Memorial Issue, Wheat Information Service No. 100
Molecular breeding and assembly of complex genotypes in wheat
Daryl J. Somers
Agriculture and Agri-Food Canada - Cereal Research Centre, 195 Dafoe Road,
Winnipeg, MB, R3T-2M9. Canada
E-mail address: SomersD@agr.gc.ca
Summary
Genetic and genotyping resources and technology are available to consider improved strategies for assembling complex genotypes in wheat. Genetic maps of wheat are well developed and densely populated with microsatellite markers. Genotyping technology via PCR and capillary electrophoresis is routine and data output can easily be coupled to software applications that archive and analyse the data. Linkage disequilibrium (LD) and association mapping studies are emerging in wheat that will facilitate 1) trait -genotype associations and 2) fine mapping of QTL. Our early results show that LD between syntenic markers is quite variable throughout the genome and is poorly correlated with interval genetic distances. The LD was studied in a collection of 96 bread wheat accessions adapted to western Canada by genotyping the germplasm at >370 microsatellite loci. The LD decayed from r2>0.5 to r2<0.2 within 5 cM when all syntenic markers pairs across the genome were examined. The LD results suggest some parts of the wheat genome may be more amenable to QTL detection and fine mapping. This manuscript discusses the resources being developed at Agriculture and Agri-Food Canada for genotype-based wheat improvement and molecular breeding with an emphasis on genetic mapping and LD.
Key words: microsatellite, linkage disequilibrium, QTL, mapping, marker assisted selection
Introduction
The purpose of this article is to bring together five different aspects of wheat improvement that are based on genotype analysis and to describe a course of experiments that develop resources and test hypotheses. The five areas of research include genetic mapping, QTL analysis, molecular breeding; association mapping and software development.
Plant genotyping and analysis of genotyping data has progressed rapidly over the last 15 years from RAPD markers to microsatellites to single nucleotide polymorphisms (SNPS) (Williams et al. 1990; Roder et al. 1998; Bryan et al. 1997; Somers et al. 2003a). It has always been the ultimate goal of mapping and genotyping research to accelerate plant breeding or to pyramid allele combinations not possible by conventional phenotype based methods. Initially, the wheat research community had access to low resolution RFLP based maps (Chao et al. 1989) and once marker density could be unproved, QTL analysis became feasible to identify the location of genes controlling traits of interest. Molecular markers have been identified for a large number of genes/alleles controlling important traits, with an emphasis on disease and pest resistance which is important for wheat production (McIntosh et al. 1998 - http:// wheat.pw.usda.gov/GG2/pubs.shtml). Wheat marketing trends worldwide have also added incentive to study more closely, the QTL and genes controlling seed quality traits (McCartney et al. 2005a; Perretant et al. 2000) and agronomic traits such as yield (Kate et al. 2000). Again, there is a large body of literature accumulating defining molecular markers and allele specific markers for genes controlling dough properties (Udall et al. 1999), flour colour (Parker and Langridge 2000), milling yield (Parker et al. 1999) etc.
QTL analysis has become a powerful means to localize the genes controlling traits, and this is very important in a genome the size of wheat where whole genome sequencing and gene annotation is unlikely, or is at least, limited. The interactions between molecular biologist and plant breeders have increased, bringing together the genotyping and gene sequence aspects of research with field-based phenotyping of traits (Gupta et al. 1999; Gupta and Varshney 2000). The importance of studying complex traits measured in field experiments has long been recognized and wheat breeders are more optimistic about applying molecular markers in their program when they can see a QTL occur repeatedly in the same chromosome location with data from different environments. In general, the ability to develop molecular markers and validate them is well established in wheat and that the application of marker-assisted selection (MAS) to wheat breeding is certainly ongoing (Charmet et al. 1999; Somers et al. 2005).
Another advance includes whole genome genotyping as opposed to MAS. I consider 'molecular breeding' a better term to describe the entire science surrounding the application of molecular markers to plant breeding. The density of wheat genetic maps was first improved by Roder et al. (1998) and Pestsova et al. (2000) with the first published microsatellite maps of wheat. Following that, Somers et al. (2004) released a high density microsatellite consensus map which incorporated the work of Roder et al. (1998) and Pestsova et al. (2000). The advantage of having high density maps is the ability to identify key recombination events in breeding populations and fine map genes. This will reduce linkage drag in MAS or molecular breeding projects and should accelerate development of elite lines. Along with the increase in markers and map density, the technical aspects of genotyping have kept pace, particularly with capillary electrophoresis instrumentation. The ABI 3100 Genetic Analyser from Applied Biosystems Inc (Foster City, CA,, USA), a 16 capillary instrument, is conservatively capable of producing >2,300 datapoints in 24 hours, which for many wheat breeding programs would be ample capacity when used effectively.
In the last five years, the number of studies of linkage disequilibrium (LD) and association mapping have increased, largely pioneered in. Human genetics (Pritchard et al. 2000; Hedrick 1987; Kalinowski and Hedrick 2001) but also in maize (Ching et al. 2002; Clark et al. 2004; Jung et al. 2004). Large scale, public projects on association mapping in wheat are not published and I will describe such a project in this article. As a minimum, association mapping requires a germplasm collection fully genotyped knowledge of the genetic structure of the germplasm collection, phenotypic data and software to perform associations between the genotypic and phenotypic data (Flint-Garcia et al. 2003). The potential exists to refine the location of QTL previously mapped on a controlled population since the germplasm collection can be larger and represent many more meioses and recombination events than can be achieved in a mapping population. Further, if single gene sequences are studied through association mapping, it is possible to identify SNPs (Somers et al. 2003a) within alleles of a gene that are responsible for changes in the phenotype of a trait (Clark et al. 2004; Jung et al. 2004).
The last aspect of wheat improvement through genotyping involves development and implementation of computer software. The software is needed to organize, archive and visualize the vast amount of genotypic data that is being generated both for genetic mapping and plant selection. Key software applications include genetic map visualization tools that are capable of comparative mapping. This includes comparative mapping of markers but also QTL locations. As well, visualization software for large allele databases generated for association mapping is needed. This facilitates comparing candidate parents of crosses to make decisions on how wide or narrow a cross may be and which parts of the wheat genome may be used to track alleles through molecular breeding.
These aspects of wheat genotyping and analysis can be taken together to derive efficient strategies for molecular breeding. It is envisioned that once we have sufficient structural (maps, haplotypes, alleles) and functional (phenotype, SNPs, QTL, genes) knowledge of the wheat genome, it will be possible to systematically assemble complex genotypes in the laboratory with a high degree of prediction of the performance of the wheat lines.
Materials and methods
Genetic material: The genetic material used in our study serves two purposes. There is a group of mapping parents, used solely for map construction and QTL analysis (to be covered below) and there is a collection of elite Canadian or Northern US wheat lines that are used in the linkage disequilibrium (LD) and association mapping studies. There were 288 lines selected for association mapping and a further 96 lines to be determined later in 2005. The 288 lines included 192 Canada western hard red spring wheat (CWRS) and 96 Canada western amber durum (CWAD) lines that are being genotyped across the genome. A single plant out of 10 was selected from each line based on genotyping with 12 microsatellites. The plant was genotypically representative of the line and this step avoids heterogeneous allele mixtures found in a bulk DNA sample, in subsequent genotype analysis. All lines were selected to be adapted to the western Canadian environment and to have been through extensive multi-year field testing and seed quality analysis.
Genotyping: All genotyping was performed on an ABI 3100 Genetic Analyser (16 capillary) using M13 tailed primers (Schuelke 2000). M13-tailing required adding the M13 sequence (CACGACGTTGTAAAACGAC) to the 5'end of the forward primer during primer synthesis. The PCR conditions were: 24 ng DNA, 1.5 mM MgCI2, 50 mM KCl, 0.8 mM dNTPs, 2 pmol reverse primer, 0.2 pmol forward primer, and 1.8 pmol M13 primer (CACGACGTTGTAAAACGAC) fluorescently labelled with 6-FAM, VIC, NED, or PET (Applied Biosystems Inc., Foster City, CA, USA), and 0.5 U Taq DNA polymerase (Promega, Madison, WI). Thermal cycling included: 94°C - 2min, 30 cycles of 95°C- 1 min, (0.5°C/ s to 61/51°C), 61/51°C -50 sec, (0.5°C/s to 73°C), 73°C - 1 min, 1 cycle 73°C - 5 min. The internal molecular weight standard for the ABI3 100 was Genescan 500-LIZ (Applied Biosystems Inc., Foster City, CA, USA). Data collected by fluorescent capillary electrophoresis was first converted to a gel-like image using Genographer available at http://hordeum.oscs.montana.edu/genographer.
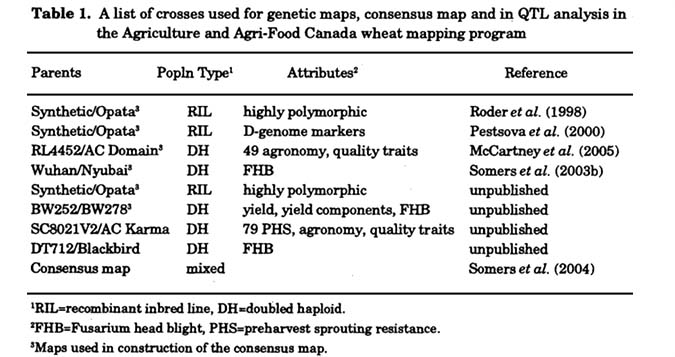
Genetic maps: There are nine genetic maps included in the program, several of these have already been published in full or partially. The T. aestivum published maps include Synthetic x Opata, Roder et al. (1998), Pestsova et al. (2000); microsatellite consensus map, Somers et al. (2004) and Wuhan x Nyubai, Somers et al. (2003b). Other T. aestivum maps include Synthetic x Opata (Somers unpublished), AC Domain x RL4452, McCarthey et al. (2005a submitted); BW252 x BW278; SC8021V2 x AC karma; and a T.durum map Blackbird x DT712 is included (see Table 1 for details). Maps were constructed with both MapMaker V2.0 (Lander et al. 1987) and with JoinMap V3.0 (Biometris, Wageningen, The Netherlands, http://www.joinmap.nl).
QTL analysis: Extensive phenotypic data was collected on the mapping populations related to Fusarium head blight (FHB) infection, agronomy and seed quality. FHB data included both type I (field rating) and type II (spread after single floret injection) resistance (Mesterhazy 1995), over 2-4 environments (Somers et al. 2003a, 2003b). Agronomy and seed quality data was measured in 2-3 environments (Table 1). QTL analysis was performed with QTL Cartographer (Wang et al. 2004) and QTL were considered reliable when QTL from different environments were coincident in genome location.
Allele database: The intention was to build a microsatellite allele database for 384 wheat lines at 374 loci. DNA was extracted from a single plant representing each line and genotyped across the genome. The 374 loci represent a core collection of microsatellite markers selected from the microsatellite consensus map (Somers et al. 2004) which amplified as a dear, robust set of alleles and the loci were distributed every 5-10 cM across the genome. The allele database records the chromosome, chromosome position based on the consensus map (Somers et al. 2004) and the allele size. Measures of LD were calculated as r2 (Hedrick 1987).
Results and discussion
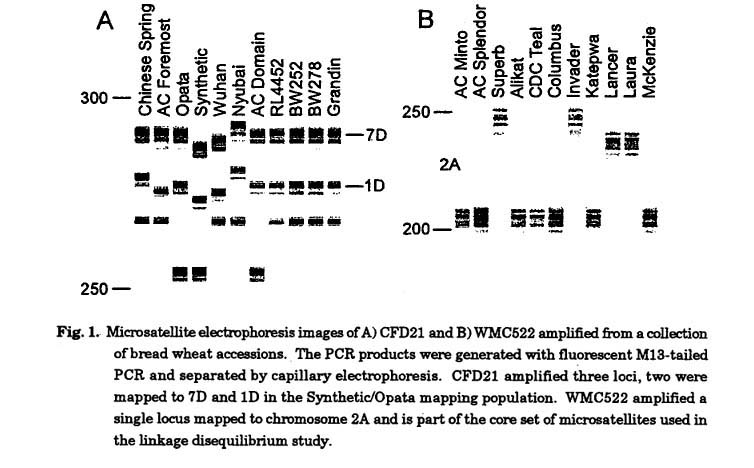
Maps, markers and QTL: The aspects of genotyped-based wheat improvement introduced are all in various stages of development at Agriculture and Agri-Food Canada - Cereal Research Centre. Genetic mapping is well established using microsatellite markers and capillary electrophoresis on the ABI 3100 Genetic Analyser (Applied Biosystems Inc, Foster City, CA, USA). Since 1999, six genetic maps have been constructed (Somers et al. 2003b; McCartney et al. 2005a) and six maps were used to assemble a microsatellite consensus map (Somers et al. 2004) (Table 1). Currently, the AAFC microsatellite consensus map has >1,200 loci mapped. Most importantly, all of the markers are PCR-based and thus amenable to wheat breeding. The microsatellite markers are not equal in utility in that some amplify complex fragment patterns such as CFD21 (Fig. 1A) or amplify poorly with some DNA preparations. As a result, the allele size of every mapped fragment in all mapping parent is recorded which facilitates identification of the same microsatellite amplicon in other wheat accessions. The consensus map has a marker density of approximately 1 marker /2.2cM (Somers et al. 2004). Assuming that typical wheat crosses have a polymorphism level of 25-30%, this marker density is certainly sufficient. for QTL analysis, gene mapping and marker development but it does pose some limitations in molecular breeding programs where accelerated restoration of the recurrent genetic background is desired.
It is important to use markers that are codominant for molecular breeding, with well resolved, non-overlapping alleles. This facilitates selection of heterozygotes and homozygotes in key generations of a wheat breeding program. The largest limitation of the current wheat genetic maps is marker density which in our experience does not provide sufficient choice of markers to meet the needs for molecular breeding. To have a codominant, robust, polymorphic marker for most wheat crosses distributed at 1 marker /10 cM would probably require doubling the marker density of the current wheat genetic maps. This higher level of density is available when RFLP and AFLP maps are combined with microsatellite maps (Rudi Appels - composite map - http://wheat.pw.usda.gov/GG2/ index . shtml) but there are limitations as well. The AFLP markers are dominant, and not useful for selection of heterozygotes. The RFLP markers are time consuming and expensive to use. Thus our emphasis at AAFC is on developing microsatellite or SNP based genetic maps of wheat that are amenable to breeding and inexpensive to implement.
A subset of 374 of the >1,200 microsatellite loci amplified from 340 primer pairs are now established that show robust amplification, genome specificity, sufficient polymorphism information content (PlC) and optimal distribution across the genome (Fig. 1B). This 'core' set of microsatellites is distributed on average 1 marker / 6.8 cM (based on the microsatellite consensus map) and can be used for all genotyping applications; the main intent of the core set of markers relates to LD and association mapping analysis to be discussed below.
Assembling complex genotypes by introgressing and pyramiding a collection of QTL requires extensive trait analysis in multiple environments followed by genotype analysis (Gupta et al. 1999). In order to establish a valid QTL target for molecular breeding, the QTL should be observed in separate mapping populations and identified in different environments. The AAFC program currently has an emphasis on validating seed quality and agronomic trait QTL. For this effort, we have used the RL4452 x AC Domain (McCartney et al. 2005a) and SC8021V2 x AC Karma mapping populations which have both been extensively phenotyped for many traits in multiple environments. Comparisons between these QTL mapping projects are planned for the future. Finding QTL in the same genome position for the same trait in different crosses provides substantial confidence to incorporate MAS for this QTL in the wheat molecular breeding program. For example, McCartney et al. (2005a) found a QTL for time to maturity mapping to 4A which was coincident with a QTL for ear emergence time identified by Araki et al. (1999) in a cross between Chinese Spring and Kanto107. Trait expression should be monitored during the initial implementation in molecular breeding populations by phenotyping at key generations. This continuously updates the value of the QTL and efficiency of the molecular breeding strategy.
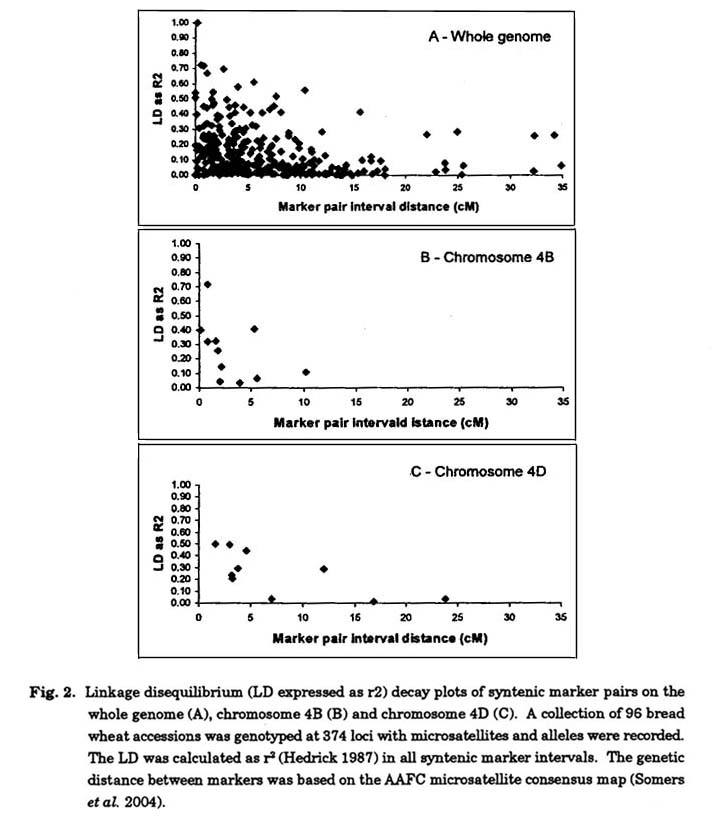
Linkage disequilibrium : The core set of microsatellites developed from the consensus map was used to genotype a set of 96 Canadian wheat accessions and varieties for whole genome LD analysis. Eventually, the data set will be increased to include 384 wheat accessions of mixed market classes and combined with extensive phenotypic data to perform association mapping of traits to genomic regions (Flint-Garcia et al. 2003; Ching et al. 2002). The results from this research are highly dependant on the germplasm collection, the structure of the population and the allele diversity represented. The results provide an understanding of the degree of LD across the genome. Overall, when all of the syntenic pairs of markers were considered, the LD decayed from r2>0.5 to r2>0.2 within 5 cM (Fig. 2A). There were examples of LD >0.4 between markers 10-15 cM apart and LD >0.25 between markers as far as 30-35 cM apart. This may be related to the structure of the population in that selection for elite breeding lines and varieties imposes selection for large haplotype blocks on some chromosomes.
The LD decay between syntenic marker pairs can also be calculated for each chromosome and Figs. 2B and 2C show contrasting LD decay results on chromosome 4B and 4D respectively. In these cases LD decayed over a shorter distance on chromosome 4B, dropping from r2>0.5 to <0.2 within 2 cM compared to chromosome 4D where the LD decays from r2>0.5 to <0.2 over 6 cM Again, this could be related to selection pressure and population structure. These results maybe indicative that the germplasm collection shows low variability for Rht-D1 alleles on chromosome 4D and is more variable for alleles at Rht-B1 on chromosome 4B. Further, significant LD (r2>0.5) could be detected on 19 of 21 chromosomes, with chromosomes 1B and 6B being the only chromosomes showing low levels of LD (r2<0.3).
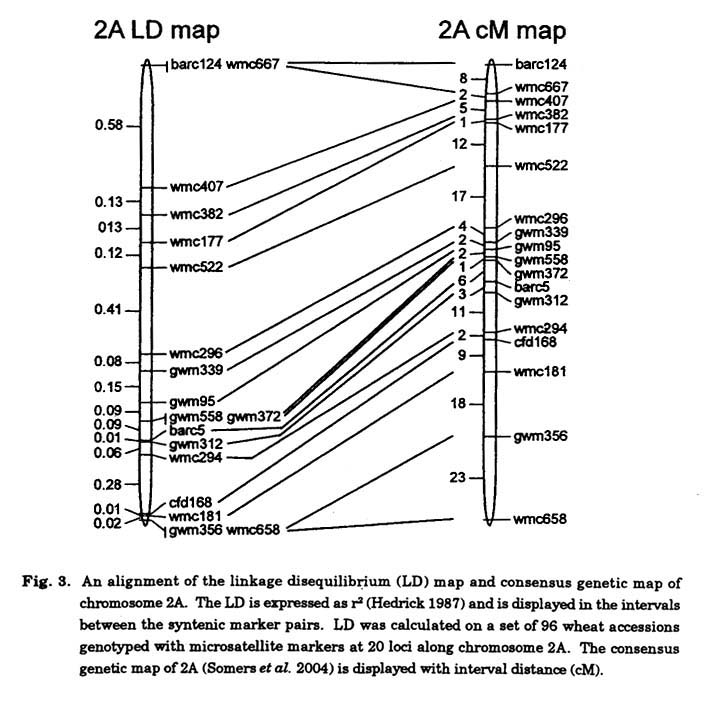
The LD present between syntenic markers along a chromosome can also be used to construct an LD map of the chromosome (Zhang et al. 2002), which displays the variation in LD between marker pair intervals along the length of the chromosome. When the LD map was aligned with the consensus genetic map (Fig. 3, chromosome 2A) we observed that the relationship between marker interval genetic distance and interval LD was variable. In fact the correlation between marker interval genetic distance and interval LD for all syntenic pairs of markers across the genome was weak (r2 = -0.22) for this germplasm collection. The core set of markers used in this study has an average interval distance of 6.8 cM With a higher density map we could expect the correlation between LD and interval distance to be stronger simply due to the influence linkage has on LD. Although, there is clear evidence that even the tight linkage group of five markers between GWM95 and GWM312 (12 cM on chromosome 2A shows very low LD (r2<0.10) in all four intervals (Fig. 3).
Taking all this together, given that the overall genetic distance for LD decay is high in wheat (∼5 cM) compared to sub-centiMorgan distances (kbp) in maize (Rafalski and Morgante 2004) and that the current marker density of the core set of microsatellites is close to the LD decay distance ( 1 marker /6.8 cM), then it seems feasible to increase the markers in the core set further and have a reasonable chance to perform association mapping and fine mapping of QTL for wheat improvement. The LD calculated in intervals across the length of a chromosome is variable, suggesting that some genomic regions will be more amenable to association mapping than others, ie. LD decay over longer distances will facilitate initial association of trait data with haplotypes in chromosome regions and LD decay over short distances will facilitate fine mapping of QTL. Researchers can use the LD map as a reference to find target QTL and genes for positional cloning.
For example, the LD is r2=0.O2 between GWM389 and GWM493 (7 cM) on chromosome 3BS. This interval is the sight of the major QTL controlling FHB resistance in wheat (Anderson et al. 2001; Somers et al. 2003b). McCartney et al. (2004) identified 55 haplotypes using six microsatellites over 7 cM genotyping 79 wheat accessions which is in agreement with the low LD in this genetic interval. The data suggest this short interval is amenable to fine mapping and association of haplotypes with phenotype given the low LD value. Conversely, McCartney et al. (2005b) completed a haplotype study around Lr16 which maps to the distal end of chromosome 2BS. In this study, there is a single conserved haplotype of five linked microsatellite alleles, in approximately a 10 cM interval, that strongly associate with the Lr16 resistance phenotype among a collection of 28 diverse Canadian wheat accessions. Only 11 haplotypes were identified using five microsatellites over 10 cM genotyping 28 wheat accessions. The LD in this same interval is r2=0.41 which agrees with the low hapiotype diversity. The data suggest fine mapping of Lr16 and other genes in this region would be more difficult given the higher LD value.
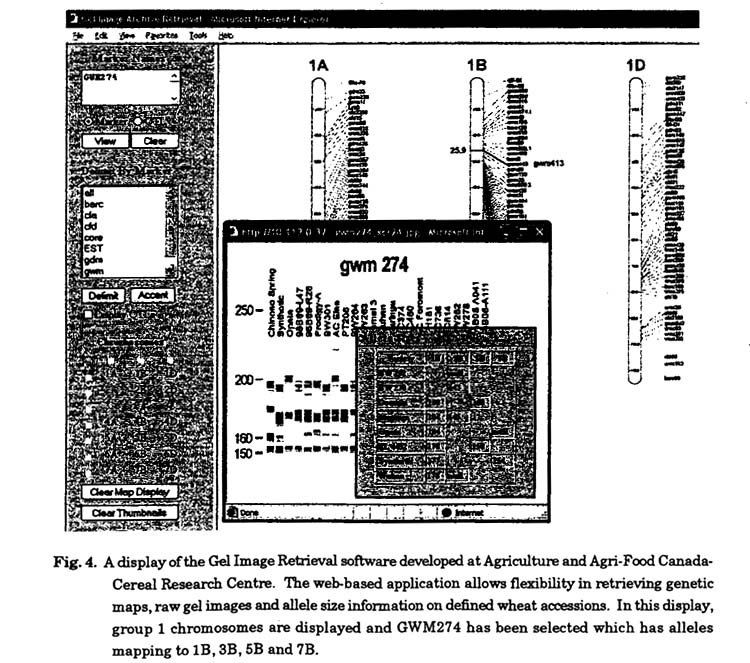
Software : The vast amount of genotyping data requires archiving and an ability to view the data graphically. There are two fundamental forms of data 1) the raw gel images or electropherograms from capillary electrophoresis and 2) locus genotypes which can include allele sizes represented in base pairs. The gel images can be tied to the allele size database, this helps researchers view raw data and know what allele size in a complex gel image to examine for their particular locus. It is essential that this linkage between raw gel images and the allele database be highly accessible in a software application, facilitating fast movement between the data types and thus easy interpretation of the genotyping data. Agriculture and Agri-Food Canada has developed such software (Fig. 4, developer Travis banks) which is web-based and provides instantaneous access to thousands of gel images and an expanding allele database. Further the application enables images to be delimited by marker type and facilitate searching for markers or QTL stored in underlying databases (Fig. 4).
The allele database developed through the study will also have a software application developed to enable analysis and viewing. The primary functions of this application will be comparative graphical views between multiple wheat accessions of individual chromosomes or the whole genome. This will serve to generate a visual display of the regions of the genome that are polymorphic between wheat parents and thus can be traced in a molecular breeding population. Further functionality will be added to incorporate LD analysis and comparisons of LD in the genome between alternate collections of germplasm.
Acknowledgements
I would like to thank the large group of researchers and technicians at the Agriculture and Agri-Food Canada - Cereal Research Centre (Winnipeg), Eastern Cereals and Oilseeds Research Centre (Ottawa) and Semi-arid Prairie Agriculture Research Centre (Swift Current) for their assistance and collaborations in the last 5 years to develop the genotyping resources. Primary funding for this research is provided by Western Grains Research Foundation, AAFC-Matching Investment Initiative and the AAFC-Canadian Crop Genomics Initiative.
References
Anderson JA, Stack RW, Liu S, Waldron BL, Field AD, Coyne C, Moreno-Sevilla B, Fetch MJ, Song QJ, Cregan PB and Frohberg RC (2001) DNA markers for Fusarium head blight resistance QTL in two wheat populations. Theor Appl Genet 102:1164-1168.
Araki E, Miura H and Sawada S(1999) Identification of genetic loci affecting amylose content and agronomic traits on chromosome 4A of wheat. Theor Appl Genet 98: 977-984.
Bryan GJ, Collins AJ, Stephanson P, Orry A, Smith B and Gale MD (1997) Isolation and
characterization of microsatellites from hexaploid bread wheat. Theor Appl Genet 94: 557-563.
Chao S, Sharp PJ, Worland AJ, Koebner RMD and Gale MD (1989) RFLP-based genetic maps of homoeologous group 7 chromosomes. Theor Appl Genet 78: 495-504.
Charmet G, Robert N, Perretant MR, Gay G, Sourdille P, Groos C, Bernard S and Bernard M (1999) Marker-assisted recurrent selection for cumulating additive and interactive QTLs in recombinant inbred lines. Theor Appl Genet 99: 1143-1148.
Ching A, Caldwell KS, Jung M, Dolan M, Smith OS, Tingey S, Morgante M and Rafalski AJ (2002) SNP frequency, haplotype structure and linkgage disequilibrium in elite maize nbred lines. BMC Genet 3:19.
Clark RM, Linton E, Messing J and Doebley JF (2004) Patterns of diversity in genomic region near the maize domestication gene tb1. Proc Natl Acad Sci USA 101: 700-707.
Flint-Garcia SA, Thornsbery JM and Buckler ES (2003) Structure of linkage disequilibrium in plants. Ann Rev Plant Biol 54: 357-374.
Gupta PK and Varshney RK (2000) The development and use of microsatellite markers for genetic analysis and plant breeding with emphasis on bread wheat. Euphytica 113: 163-185.
Gupta PK, Varshney RK, Sharma PC and Ramesh B (1999) Molecular markers and their applications in wheat breeding. Plant Breed 118: 369-390.
Hedrick PW (1987) Gametic disequilibrium measures: proceed with caution. Genetics 117: 331-341.
Jung M, Ching A, Bhattramakki D, Dolan M, Tingey S, Morgante M and Rafalski A (2004) Linkage disequilibrium and sequence diversity in a 500-kbp region around the adh1 locus in elite maize germplasm. Theor Appl Genet 109: 681-689.
Kalinowski ST and Hedrick PW (2001) Estimation of linkage disequilibrium or loci with multiple alleles: basic approach and an application using data from bighorn sheep. Heredity 87: 698-708.
Kate K, Mirua H and Sawada S (2000) Mapping QTLs controlling grain yield and its components on chromosome 5A. Theor Appl Genet 101: 1114-1121.
Lander ES, Green P, Abrahmson J, Barlow A, Daly MJ, Lincoln S and Newberg L (1987) MAPMAKER: an interactive computer package for constructing primary genetic linkage maps of experimental and natural populations. Genomics 1: 174-181.
McCartney CA, Somers DJ, Fedak G and Cao W (2004) Haplotype diversity at Fusarium head blight QTLs in wheat. Theor Appl Genet 109: 262-271.
McCartney CA, Somers DJ, Humphreys DG, Lukow 0, Ames N, Noll J, Cloutier S and McCallum BD (2005a) Mapping quantitative trait loci controlling agronomic traits in the spring wheat cross RL4452_ AC Domain. Genome (Submitted).
McCartney CA, Somers DJ, McCallum BD, Thomas J, Humphreys DG, Menzies JG and Brown PD (2005b) Microsatellite tagging of the leaf rust resistance gene Lr16 on wheat chromosome 2BS. Mol Breed (in press).
McIntosh RA, Hart GE, Devos KM, Gale MD, Rogers WJ, Dubcovsky J and Morris CF (1998) Catalogue of gene symbols for wheat. Annual supplement available at http://wheat.pw.usda.gov/GG2/ pubs.shtml.
Mesterhazy A (1995) Types and components of resistance to Fusarium head blight. Plant Breed 114: 377-386.
Parker GD and Langridge P (2000) Development of a STS marker linked to a major locus controlling flour colour in wheat (Triticum aestivum L.). Mol Breed 6: 169-174.
Parker GD, Chalmers KJ, Rathjen AJ and Langridge P (1999) Mapping loci associated with milling yield in wheat (Triticum aestivum L.). Mol Breed 5: 561-568.
Perretant MR, Cadalen T, Charmet G, Sourdille P, Nicolas P, Boeuf C, Tixier MH, Branlard G, Bernard S and Bernard M (2000) QTL analysis of bread-making quality in wheat using a doubled haploid population. Theor Appl Genet 100: 1167-1175.
Pestsova E, Ganal MW and Roder MS (2000) Isolation and mapping of microsatellite markers specific for the D genome of bread wheat. Genome 43: 689-697.
Pritchard JK, Stephens M, Rosenburg NA and Donnelly P (2000) Association mapping in structured populations. Am J Hum Genet 37: 170-18 1.
Rafalski A and Morgante M (2004) Corn and humans: recombination and linkage disequilibrium in two genomes of similar size. Trends Genet 20: 103-111.
Roder MS, Korzun V, Wandehake K, Planschke J, Tixier MH, Leroy P and Ganal MW (1998) A microsatellite map of wheat. Genetics 149: 2007-2023.
Schuelke M (2000) An economic method for the fluorescent labelling of PCR fragments. Nat Biotech 18:233-234.
Somers DJ, Fedak G and Savard M (2003b) Molecular mapping of novel genes controlling Fusarium head blight resistance and deoxynivalenol accumulation in spring wheat. Genome 46: 555-564.
Somers DJ, Isaac P and Edwards K (2004) A high density microsatellite consensus map for bread wheat (Triticum aestivum L.). Theor AppI Genet 109: 1105-1114.
Somers DJ, Kirkpatrick R, Moniwa M and Walsh A (2003a) Mining single nucleotide polymorphisms from hexaploid wheat ESTs. Genome 49: 431-437.
Somers DJ, Thomas J, DePauw R, Fox S, Humphreys.G and Fedak G (2005) Assembling complex genotypes to resist Fusarium in wheat (Triticum aestivum L.). Theor Appl Genet (submitted).
Udall JA, Souza. E, Anderson J, Sorrells ME and Zemetra RS (1999) Quantitative trait loci for flour viscosity in winter wheat. Crop Sci 39: 238-242.
Wang S, Basten CJ, Gaffney P and Zeng ZB (2004) Windows QTL Cartographer 2.0. User Manual. Bioinformatics Research Centre, North Carolina State University, Raleigh, NC.
Williams JGK, Kubelik AR, Livak KJ, Rafalski JA and Tingey SV (1990) DNA polymorphisms amplified by arbitrary primers are useful as genetic markers. Nucleic Acids Res 18: 6531-6535.
Zhang W, Coffins A, Maniatis N, Tapper W and Morton NE (2002) Properties of linkage disequilibrium LD maps. Proc Natl Acad Sci USA 99:17004-17007.