Memorial Issue, Wheat Information Service No.100
Genome science of polyploid wheat
Yasunari Ogihara
Laboratory of Genetic Engineering, Graduate School of Agriculture,
Kyoto Prefectural
University and Kyoto Prefectural Institute of Agricultural Biotechnology, Hangi-cho
1-5,
Shimogamo, Kyoto 606-8522, Japan
E-mail address: yogihara@kpu.acjp
Key words: genome research, functional genomics, organellar genome structure, genome diversity, polyploid wheats
Introduction
Polyploidy is a characteristic feature of plant genomes (Soltis and Soltis 2000; Vision et al. 2000; Wendel 2000), and as much as 70% of all angiosperms were polyploid at some stage during their evolution (Masterson 1994; Leitch and Bennett 1997). Polyploidy leads to an increase in gross genetic information, but its presence makes it difficult to analyze genome structure and gene regulation. Common wheat, which is characterized by polyploidy, is an allohexaploid that possesses three distinct genomes(AABBDD; Lilienfeld 1951). Because the genetic relationships among wheat species have been extensively characterized (Tsunewaki 1993), wheat species (Triticum-Aegilops group) can be used as a model system to study the genomics of polyploid plants. However, the wheat genome is exceptionally large, with a diploid genome of about 5 gigabase pairs (Gbp). Thus, allohexaploid common wheat possesses a genome of approximately 16 Gbp, which is 40 times the size of the rice genome (430 MB; Sasaki 2003). This inherent complexity has led geneticists to carry out their studies of the wheat genome using expressed sequence tags (ESTs). In fact, as of June 10, 2005, there are approximately 590,000 wheat ESTs available in the National Center for Biotechnology Information EST database ( http://www.ncbi.nlm.nih.gov/dbEST/ dbEST_summary.html).
Recently, we examined a large number of ESTs expressed in 32 tissues throughout the life cycle of the plant. We were able to classify these ESTs into distinct contigs among the three genomes (Ogihara et al. 2003). We have also started a project for full length cDNAs of common wheat (Ogihara et al. 2004). By assembling these EST data, we have recently constructed 22- and 11-kb oligonucleotide DNA microarrays in collaboration with Agilent Technologies (Kawaura et al. 2005).
As for the organellar genomes, the entire sequences of chloroplast (Ogihara et al. 2002) and mitochondria DNA (Ogihara et al. 2005) of common wheat (Triticum aestivum cv. Chinese Spring) have been determined. Furthermore, despite the complexity of its genome, an international collaboration for sequencing the common wheat genome has been started (Gill et al. 2004). Also, the Transformation Competent Artificial Chromosome (TAC) library of Chinese Spring wheat was constructed to select clones harboring target genes for direct transformation of cereals (Liu et al. 2000). These recent innovations enable us to conduct functional genomics even in hexaploid wheat. Genome research on wheat is entering a new era in which functional analyses of individual genes and their associated networks are possible. Here, I described recent developments in the common wheat genomics.
Structural features of organellar genomes in common wheat
The genome constitutions of each species belonging to the Triticum-Aegilops complex and the phylogenetic relationships among them are well defined (Kihara 1954). In addition to nuclear genome analysis, nucleus-cytoplasm hybrids have been established by combining tester nuclei from common wheat with the cytoplasms from all other Triticum-Aegilops species (Tsunewaki 1993). By cultivating these nucleus-cytoplasm hybrids, the biological effects of alien plasmons can be analyzed precisely, and, as a result, the molecular basis of nucleus-cytoplasm interaction in wheat species can now be clarified.
(1) Structural features of chloroplast DNA in Chinese
Spring wheat
Structural features of the wheat plastome were clarified by comparison of the
complete chloroplast DNA sequence of wheat with those of rice and maize
(Ogihara et al. 2002). The wheat plastome consists of a 134,545-bp
circular molecule with 20,703-bp of inverted repeats (Fig. 1) and the same gene
content as the rice and maize plastomes. However, some structural divergence
was found even in the gene coding regions. These alterations are due to illegitimate
recombination between two short direct repeats and/or replication slippage.
Overall comparison of chloroplast DNAs among the three cereals indicated the
presence of some hot-spot regions for length mutations. Whereas the region with
clustered tRNA genes and that downstream of rbcL showed species-specific
divergence, the deletion patterns of open reading frames in the inverted-repeat
regions and in the borders between the inverted repeats and the small single-copy
region support the idea that wheat and rice are related more closely to each
other than to maize.
(2) Structural alterations of chloroplast DNAs found
in Triticum-Aegilops species
In addition to molecular analysis of structural alterations of chloroplast DNAs
among cereals, we determined the precise location and nature of each of 14 length
mutations detected by RFLP analysis among chloroplast DNAs of Triticum-Aegilops
species (Ogihara and Tsunewaki 1988) at the level of the nucleotide sequence
(Ogihara and Ohsawa 2002). Each mutation was compared with at least three nonmutated
wild-type plastomes as standards. These 14 length mutations were classified
into 4 duplications and 10 deletions (Fig. 1). One duplication occurred in the
small single-copy region dose to the border of the inverted repeat, and the
remaining 13 length mutations took place in the large single- copy region. All
length mutations occurred in the intergenic regions, suggesting that these length
mutations do not affect plastid gene expression. All of the duplications were
due to saltatory replication, whereas intramolecular recombination mediated
by short direct repeats played a substantial role in the deletions (Ogihara
et al. 1988). Recurrence of certain deletion events was found in some
AT-rich regions indicating that they were hot spots for deletion. Out of four
hypervariable regions detected among the grass plastomes, two (downstream of
rbcL and a tRNA gene accumulated region) were still active after differentiation
of the Triticum-Aegilops complex.
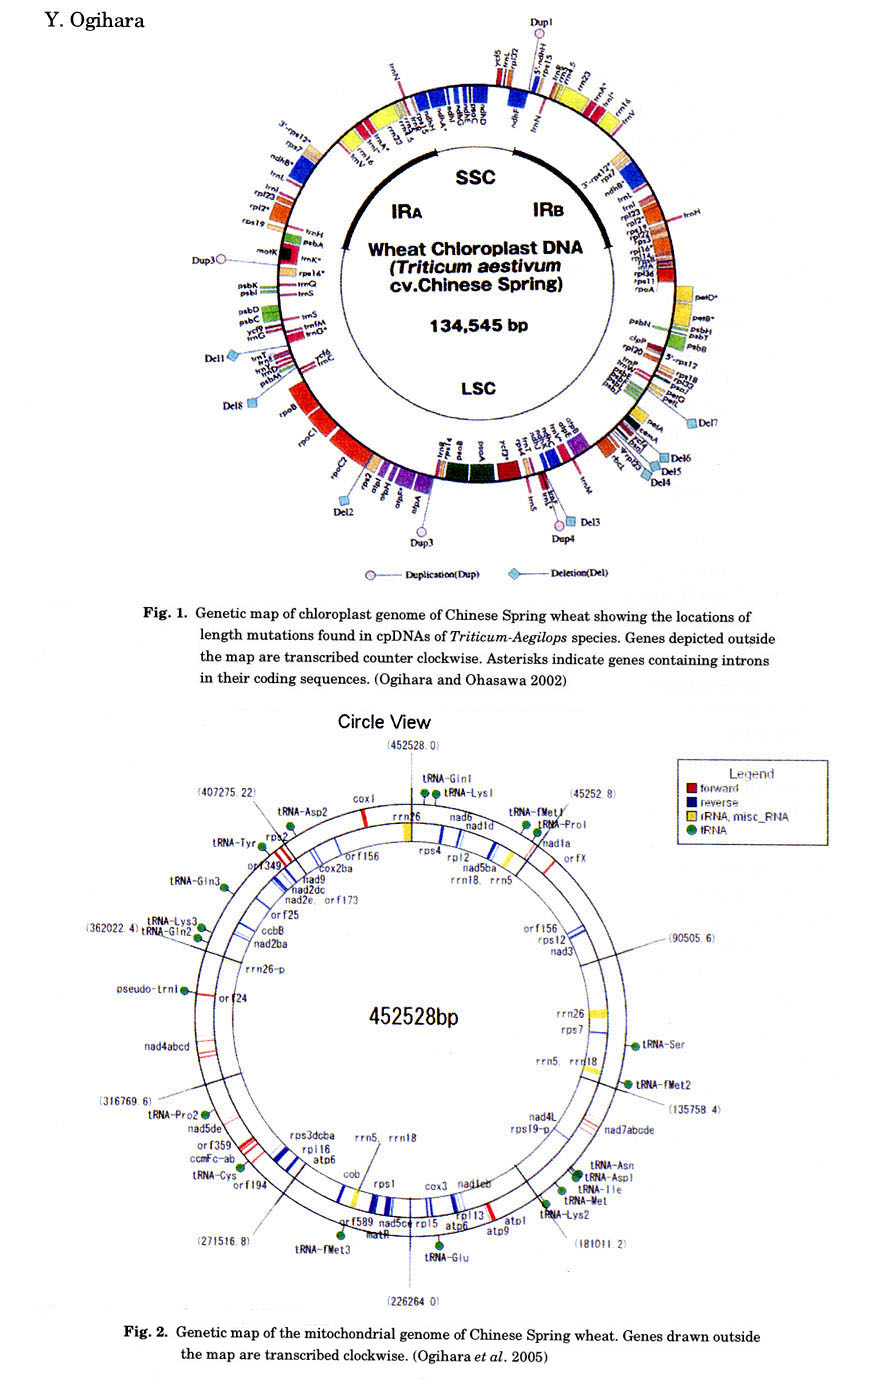
(3) Structural features of mitochondrial
DNA in Chinese Spring wheat
Structural features of the wheat chondriome were clarified by comparing the
complete mitochondrial DNA sequences from wheat and rice. The mitochondrial
genome of Chinese Spring wheat has been sequenced using 25 cosmid clones of
mitochondrial DNA that were selected on the basis of their gene content. As
shown in Fig. 2, alignment of the clones led to one circular DNA (452,528 bp).
Ten clones were the products of intra-molecular recombination mediated by direct
or inverted repeats. A total of 55(71) genes were identified as follows: 18
(20) genes for electron transport system, 4 for mitochondrial biogenesis, 11
for ribosomal proteins, 2 for splicing and other function, 3 (10) for rRNAs,
and 17 (24) for tRNAs (number of genes counting multiple copies of a gene separately
is given in parentheses.). Wheat mitochondrial genome contains the homologues
of all rice mitochondrial genes, except rpl2. The
genes for atp6, atp8, rrn5, rrn18, trnD, trnfM, trnK, trnP,
and trnQ were found to have higher copy numbers
in wheat than in rice.
We compared the mitochondrial gene maps among wheat, rice, and maize. Other than a block of two to five genes, remarkable synteny was not found between them. Mitochondrial genes were thoroughly shuffled during the speciation of cereals. In contrast, the chloroplast genes show almost perfect synteny among wheat, rice and maize.
(4) The plasmon of Aegilops crassa induces
photoperiod-sensitive cytoplasmic male sterility (PCMS)
Alloplasmic T. aestivum cv. Norin 26 with Ae. crassa cytoplasm
shows PCMS. This alloplasmic line expresses pistillody of anthers only when
grown in long-day conditions (>15 h light). To assess the molecular basis
of the PCMS, we carried out Southern and northern hybridization analyses on
mitochondrial DNAS and RNAs isolated from seedlings of alloplasmic lines showing
various PCMS phenotypes. Using probes for 12 mitothondrial genes (Ogihara et
al. 1997), we found that all RFLP patterns of mitochondrial DNA from alloplasmic
lines greatly differed from those of common wheat, and they showed slight modification
from their parental species (i.e., Ae. crassa). This indicates that
nuclear substitutions between related plant species induce structural alterations
in the mitochondrial genome. Furthermore, the RFLP patterns of (cr)-N61
and FR-mutant probed with cox3 and atp4 were identical to
each other but different from those of the other alloplasmic lines. This indicates
that the nuclei of N61 and FR-mutant harbor some gene(s) that induces structural
alterations in the cox3 and atp4 regions of the mitochondrial
genome. We also found that the transcription patterns of atp6 and cob
in Ae. crassa were different from those in T. aestivum. Furthermore,
the atp4 transcript in alloplasmic wheats was about 300 nucleotides
longer than that of euplasmic lines, including the Ae. crassa pure
line, suggesting that transcription patterns of atp4 are associated
with recovery from the PCMS. These data clearly show the cross-talk between
the nuclear genome and chondriome. These observations raise the possibility
that the dysfunction of mitochondria, caused by a failure of cooperative control
of mitochondrial gene expression, influences the flower morphogenesis pathway,
especially in the process by which organ identity is determined.
Large-scale analysis of ESTs in common wheat
Because of limitations to full-scale genome sequencing of polyploid wheat, accumulation and analyses of wheat ESTs are especially important. The large body of EST data represents a convenient starting point for investigating functional genes in wheat, and multi- dimensional analysis of ESTs, which is analogous to microarray experiments (Eisen et al. 1998; Ewing et al. 1999), may offer a new system for functional annotation of anonymous genes. The collection of these expressed genes is becoming an indispensable genetic resource for conducting functional genomics in common wheat.
(1) Construction of a body map of ESTs in typical tissues
during the wheat life cycle
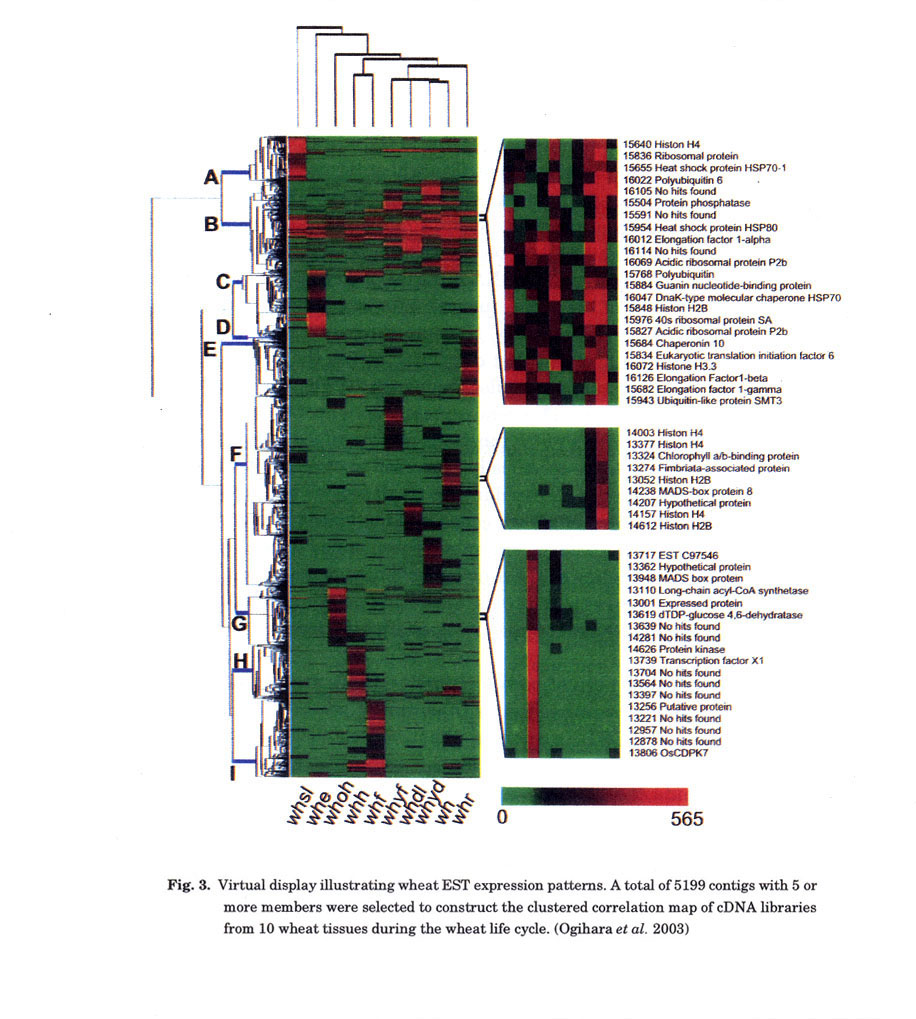
To assess global changes in gene expression patterns in the wheat life cycle,
we conducted large-scale analysis of ESTs in common wheat. Ten wheat tissues
were used to construct cDNA libraries: crown and root from 14-day-old seedlings;
spikelet from early and late flowering stages; spike at the booting stage; heading
date and flowering date; pistil at the heading date; and seeds at 10 and 30
days post-anthesis. Several thousand colonies were randomly selected from each
of these 10 cDNA libraries and sequenced from both 5'- and 3'-ends. Consequently,
a total of 116,232 sequences were accumulated and classified into 25,971 contigs
based on sequence homology. By computing abundantly expressed ESTs, we identified
gene expression patterns that correlated across the tissues. Furthermore, relationships
between gene expression profiles among the 10 wheat tissues were inferred from
global gene expression patterns. This gene expression profile was designated
as Virtual Display (VD) (Fig. 3). Genes with similar functions were grouped
together by clustering the gene expression profiles. Genes specifically expressed
in each of the 10 tissues as well as housekeeping genes that were expressed
in almost all tissues were characterized.
Although expression patterns of known genes could be traced in the 10 tissues, many genes whose counterparts and functions are unknown remained to be characterized. This technique might enable estimation of the functions of anonymous genes. The wheat EST data and their expression patterns in the 10 tissues during the wheat life cycle are available at http://shigen.lab.nig.ac.jp/wheat/komugi/ests/tissueBrowse.jsp
(2) Construction of a body map of comprehensive ESTs
and its application to in silico screening of stress response genes
in common wheat
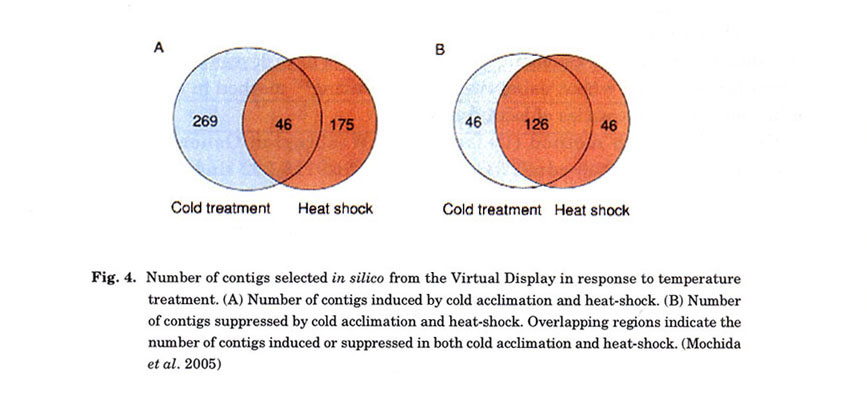
In addition to a body map of ESTs in common wheat, we conducted a large-scale
analysis of ESTs to assess global changes of gene expression patterns in stress-induced
tissues of common wheat (Mochida et al. 2005). Twenty-one cDNA libraries
derived from stress induced tissues (e.g., callus), as well as liquid cultures
and abiotic stress conditions (temperature treatment, desiccation, photoperiod,
moisture, and abscisic acid) were constructed. Several thousand colonies were
randomly selected from each of these 21 cDNA libraries and sequenced from both
the 5'- and 3'-ends. Correlated expression patterns of genes across the tissues
were monitored (Virtual Display) by computing abundantly expressed ESTs. Furthermore,
the relationships between gene expression profiles among the stress-treated
tissues were inferred from their patterns of gene expression. For example, genes
specifically induced and/or suppressed by cold acclimation and heat-shock treatments
were selected in silico (Fig. 4). From these genes, 490 showing at
least 5-fold induction and 218 showing suppression in comparison to the control
were selected. These selected genes were annotated by a BLAST search. Genes
regulated in response to temperature treatment were successfully selected, indicating
that this method can be applied to other stress treated tissues. In silico
selection of screened genes from a virtual display should provide a powerful
tool to trace the expression patterns of known genes and to estimate the functions
of unknown genes.
(3) Single nucleotide polymorphism (SNP) analysis of
homoeologous genes in hexaploid wheat
Because SNPs are the most abundant polymorphisms among individuals and because
they allow high-throughput data acquisition, they are emerging as a new generation
of markers to detect polymorphisms even among plant strains. Wheat is characteristically
allopolyploid, and SNP analysis is more difficult for polyploids than for diploids.
The ratio of SNP alleles varies in polyploid genomes, and the haplotypes among
multigenomes are difficult to determine (Rickert et al.
2002). Recently, we examined a large number of ESTs expressed in 10 tissues
throughout the wheat life cycle. We were able to classify these ESTs into distinct
contigs among the three genomes. We have developed a new SNP analysis system
for hexaploid wheat using the PyrosequencingTM
method in combination with a nullisomic-tetrasomic series of hexaploid wheat.
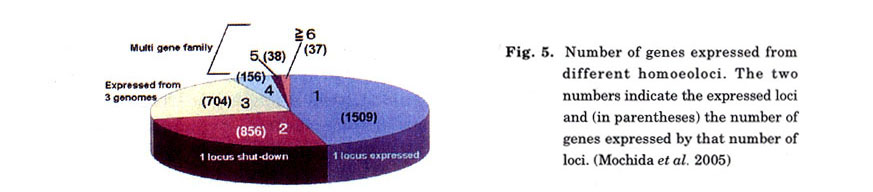
Using the phrap method (University of Washington Genome Center; http://www.genome.washington-edu/UWGC), we classified 116,232 single-pass sequences of cDNAs from both 5'- and 3'-ends derived from 10 tissues throughout the wheat life cycle, into 25,971 contigs (Ogihara et al. 2003). Of these, 5199 contigs that had 5 or more members showing relatively abundant gene expression were selected for further analysis. These 5199 contigs were grouped into 3300 distinct gene clusters using the BLAST method (Fig. 5). The 3300 gene clusters were searched for their counterparts using a BLAST search against the remaining 20,772 contigs. Consequently, approximately half of the contigs had no counterparts, suggesting diploidization in the hexaploid (Ozkan et al. 2001; Shaked et al. 2001). Based on sequence comparison, it is highly likely that gene clusters with one, two, or three contig members were single-copy genes (93.0%) and that those with more than four were composed of multigene families (7.0%).
For SNP analyses among the three genomes, we first adopted gene clusters with two or three contig members. Next, the 1,560 gene clusters belonging to this category were selected. By realignment of the contigs in the gene cluster using the phrap method, we were able to detect the SNP sites among the three genomes. To amplify these SNP sites by PCR,we searched for the exon region of 1,560 gene dusters in the database for the indica rice genome (Yu et al. 2002). The frequency of SNPs of common wheat among the three genomes was calculated to be once per 144.9 bp. Because a number of SNPs were found in each of the contigs, these haplotypes can be distinguished by combinations of homoeologous SNPs among the three genomes (Mochida et al. 2003).
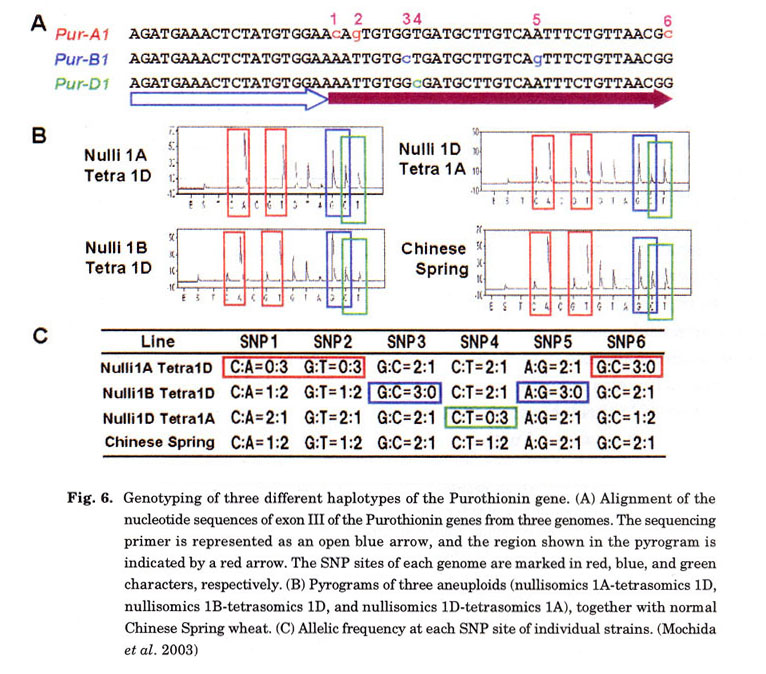
Haplotypes harboring several SNPs were assigned by PyrosequencingTM to each chromosome of the three (A, B, and D) genomes. Purothionin genes were adopted as an example because the complete sequences of the genes from the three genomes have been determined (van Campenhout et al. 1998). From the position designed for the sequencing primer, the DNA sequences of the three genomes were determined simultaneously by PyrosequencingTM. A Pyrogram is presented in Fig. 6. From the height of the sequencing peak, we calculated the ratio of nucleotides. By comparing the ratio where SNPs were found in the nullisomic-tetrasomic series, we were able to assign the contigs (haplotypes) to their homoeologous chromosomes. The Pyrogram data completely supported the previous chromosome assignment of the purothionin gene (van Campenhout et al. 1998). Pyrosequencing was superior to other systems, such as DHPLC (Hoogendoorn et al. 1999) and SnapShot (Makridakis et al. 2001), because of its ability to perform dose-response and high-throughput analysis. Furthermore, PyrosequencingTM data was available for several dozens of sequences, which provides information not only for the ratio of SNPs in the hexaploid background but also for the linkage of SNPs belonging to the discriminating haplotype in the three genomes. Consequently, only the PyrosequencingTM method can be employed for SNP analysis among cultivars or strains of polyploid wheat. In fact, we have begun a project for SNP analysis among common wheat strains using this method.
By repeating the PyrosequencingTM of Chinese Spring and its nullisomic-tetrasomic series, 270 haplotypes of 90 gene clusters were assigned to chromosomes (Table 1). The chromosomal locations of the assigned genes were almost evenly distributed among chromosomes. Amongst these gene markers, there was a number of novel genes showing no homology to the DNA database. Because SNPs are highly polymorphic, these SNPs are sources of potential makers that can map to any transcribed region in the chromosomes. Thus, every gene should contain a few SNPs, even between strains (Cho et al. 1999). These high-density EST markers, combined with the QTL database of phenotypic characteristics ( http://wheat.pw.usda.gov/GG2/index.shtml), will provide a new breeding system (i.e., gene mediated breeding instead of marker-assisted selection; Lange and Whittacker 2001).
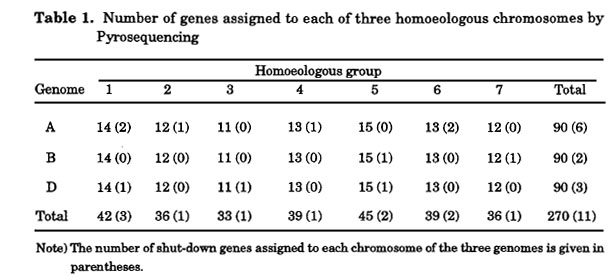
SNP analysis in combination with virtual display of ESTs (Ogihara et al. 2003) can be applied to assess the expression profiles of homoeologous genes in different tissues (Fig. 7). The number of EST constituents assigned to 10 cDNA libraries was scored for each contig, producing a two-way expression profile (i.e., contig vs. library). Based on the EST constituent matrix, hierarchical clustering was constructed according to the method of Eisen et al. (1998). In addition to gene dusters expressed in a tissue-specific manner, genes commonly expressed throughout the 10 tissues were found. Remarkably, this kind of investigation can discriminate the expression patterns from homoeologous genes of three different genomes (i.e., A, B, and D). Out of the 270 genes presented in Table 1,237 were expressed from three genomes, whereas the remaining 22 genes were only expressed from two genomes, indicating that those genes expressed in only a single genome were continuously shut down during the wheat life cycle. The exons of all 90 genes could be amplified by PCR, indicating that, even if they were not a complete set, they were maintained in each of the three genomes.
Chromosome assignments of shut-down genes are also presented in Table 1. Six genes were assigned to the A genome, two to the B genome, and three to the D genome. Shut down of gene expression occurred almost uniformly between seven homoeologous groups (Table 1), showing no preference for shut-down of gene expression among the three genomes and seven homoeologous groups. This indicates that suppression of gene expression in certain genomes took place for both genes in a pair of homologous chromosomes but that it did not occur at the level of the homoeologous group or genome. In terms of the mechanism of gene expression shut-down, mutation at the promoter region (Nemoto et al. 2003), methylation (Shaked et al. 2001), or gene silencing (Scheid et al. 2002) are plausible because at least part of the exons were retained in all genomes.
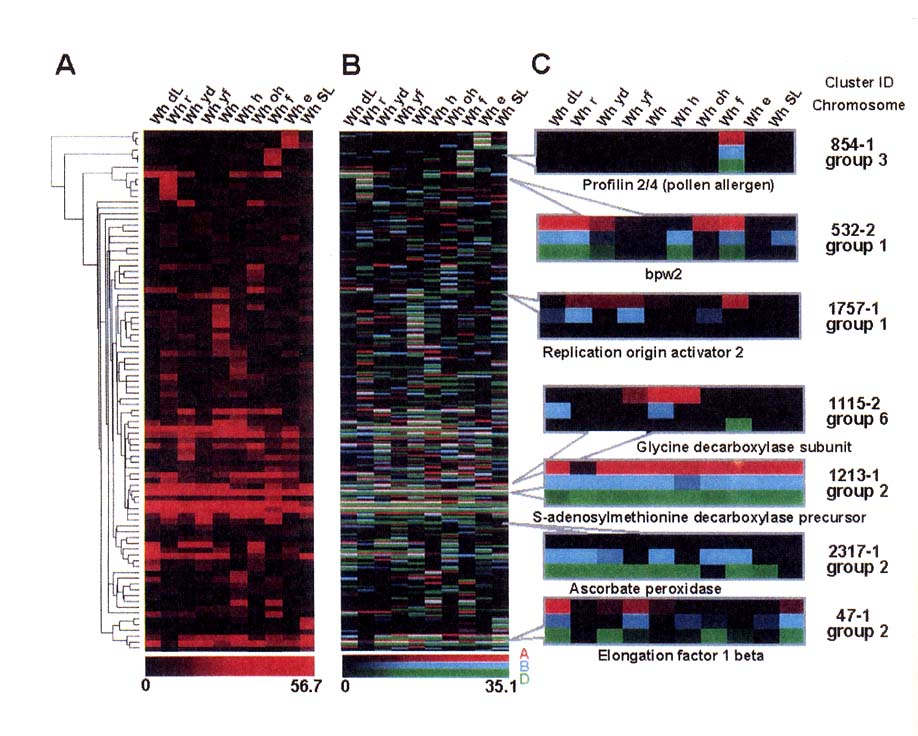
Fig. 7.
Clustered correlation display of wheat EST data. Ninety genes that were subjected
to pyrosequencing were used to construct the clustered correlation map from
the cDNA libraries of the 10 wheat tissues. Shown in the top of the panel are
the 10 tissues from which the cDNA libraries were constructed: WhdL, crown of
seedling; Whr, root; Whyd, spikelet at early flowering; Whyf, spikelet at late
flowering; Wh, spike at bolting stage; Whh, spike at heading date; Whoh, pistil
at heading date; Whf, spike at flowering date; Whe, seed at 10 days post-anthesis;
WhSL, seed 30 days post-anthesis. (A) Virtual display of the pooled gene expression
patterns. The color scale ranges from saturated black (0 members) to red (85
members). The expression profile of each gene is represented by a single row
of colored boxes, and that of each library is represented by a single column.
The brackets indicated on the left show the clusters formed based on similarities
in expression pattern. (B) Gene expression patterns of the three homoeologous
loci are separately displayed. Red indicates gene expression from the A genome,
blue indicates expression from the B genome, and green indicates expression
from the D genome. The color scale ranges from saturated black (0 members) to
each of the three colors (35 members). (C) Some contig identities are shown
in expanded regions. Annotations of each contig deduced from homology searches
in the DNA database are given below each panel. The contig number and chromosomal
location are also given on the right. (Mochida et al. 2003)
(4) Construction and characterization
of a full-length cDNA library in Chinese Spring wheat
Especially in common wheat, full-length cDNAs provide essential information
that can be used to annotate the genes and can be used to determine their functions
and the function of their products. In collaboration with RIKEN, KOMUGI, and
the wheat genomics consortium of Japan, we constructed a full-length cDNA library
of Chinese Spring wheat. Previously, we had obtained 24,056 ESTs derived from
young spikelets of Chinese Spring wheat. These ESTs were grouped into 3605 contigs
and 1902 gene clusters (Ogihara et al. 2004). Additionally, we constructed
a new full-length cDNA library derived from the pooled RNAs extracted from the
17 different tissues of Chinese Spring wheat. The 19,968 clones were sequenced
from both ends. These sequences were classified into 25,502 contigs with the
phrap method, and 15,197 gene dusters with BLASTn. Subsequently, these gene
dusters were assembled into 7,149 unique gene clusters. Out of the 7,149 genes,
4,168 cDNAs were entirely sequenced. Of the full-length cDNAs, 18.7% were
unique when compared against the 32,881 ESTs in the common wheat database. Furthermore,
a homology search against the rice full-length cDNA database (Knowledge-based
Oryza Molecular biological Encyclopedia: KOME) showed that 8.9% of wheat
cDNAs were unique. These results strongly suggest that a full-length cDNA library
of common wheat might provide efficient source to study comparative functional
genomics of cereals.
(5) Construction of an oligo DNA microarray and its
use for the profiling of gene expression in response to salt stress in common
wheat
In collaboration with Agilent Technologies, we constructed a 22-kb wheat oligo
DNA microarray. We collected 148,676 ESTs of common wheat from the EST database
of the Wheat Genomics Consortium of Japan. These ESTs were grouped into 34,064ar
contigs, which were then used for the design of an oligonudeotide DNA microarray.
After multiple predictions for the sense strand, 21,939 60-mer oligo-probes
were synthesized directly on the glass-slide. This 22-kb oligo DNA microarray
was employed for profiling of wheat transcripts in response to salt stress (Kawaura
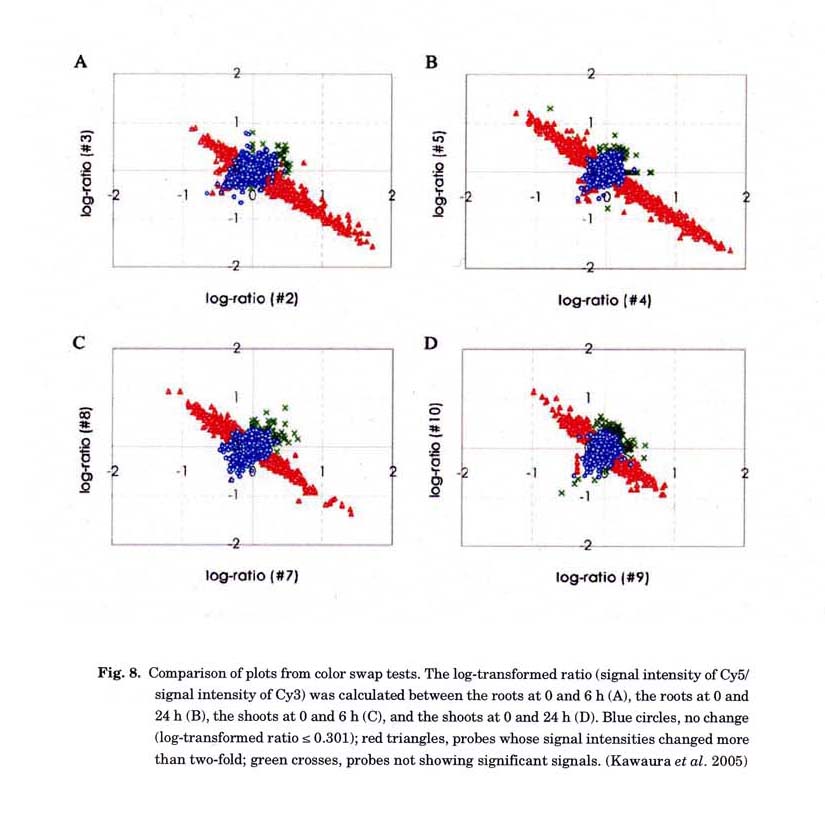
et al. 2005). More than 95% of probes gave reproducible and reliable
hybridization signals for the RNAs extracted from salt-treated wheat shoots
and roots (Fig. 8). We identified 1,811 genes whose expressions were changed
more than two-fold by the salt treatment These included typical salt-responsive
genes as well as unknown genes. The expression profiles of these 1,811 genes
were classified into 12 major groups by the hierarchical clustering (Fig. 9),
and the gene expression patterns were confirmed by real-time RT-PCR. These results
indicate that the wheat 22-kb oligo DNA microarray allows reliable monitoring
of global gene expression patterns.
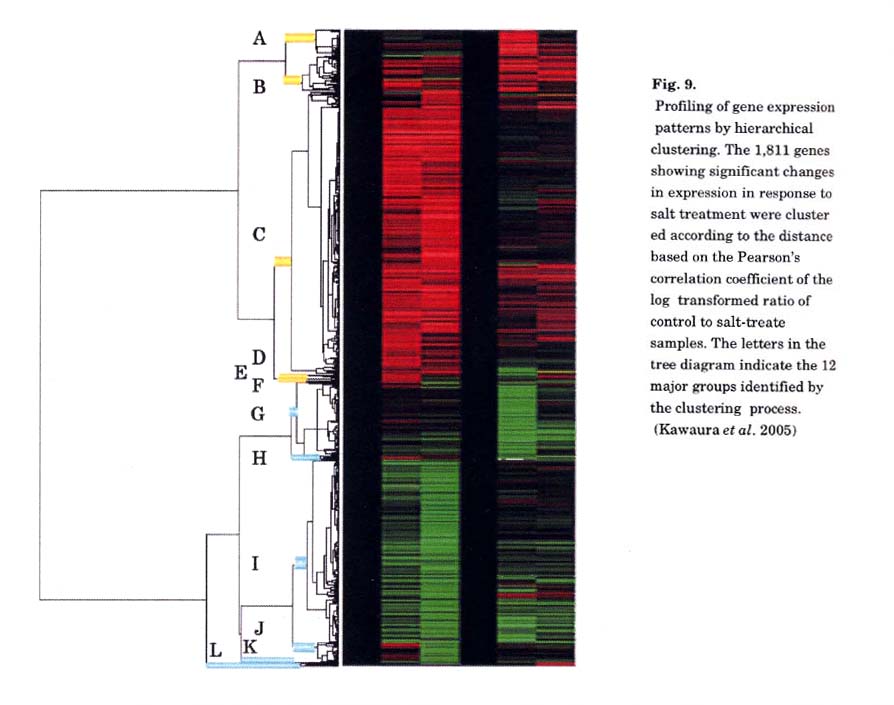
Most of known genes positioned in the salt stress signaling pathways were clustered in certain groups. Because many genes of unknown function were categorized in the same dusters as known genes, monitoring of unknown gene expression patterns in combination with gene ontology should help estimate their function. Furthermore, functional analysis of these wheat genes could provide new insight into the reactions to salt stress.
In addition to this 22-kb oligo DNA array, we constructed an 11-kb oligo DNA array in collaboration with Agilent Technologies. This 11-kb oligo DNA array contains 10,263 genes that were selected from 23 cDNA libraries and were independent from those in the 22-kb oligo DNA array (Mochida et al. 2005). Some of these 23 cDNA libraries were from abiotic stressed-tissues, and the 232,008 total ESTs from these cDNA libraries were grouped into 40,097 contigs. After using a BLASTn search (E = 10-60) to omit contigs homologous to the genes spotted onto the 22-kb oligo DNA array, the contigs were self-grouped by BLASTn (E = 10-60) into 12,749 nonredundant gene dusters. After multiple predictions for the sense strand, as in the case of the 22-kb array, 10,263 60-mer oligo-probes were synthesized directly on the glass slide as the 11-kb oligo DNA microarray.
This 11-kb oligo DNA microarray was used for the profiling of wheat transcripts in response to salt stress. The probes were hybridized with the same targets as the 22-kb oligo probes. More than 90% of the probes gave reproducible and reliable hybridization signals. Whereas 1,811 genes of the 22-kb oligo DNA array (8.3%) showed a more than two-fold change in expression after salt treatment, 1,311 genes in the 11-kb array (13.0%) showed elevated expression after the same treatment. This indicates that the 11-kb oligo DNA array contains many more abiotic stress-responsive genes than the 22-kb array. Consequently, expression profiling of more than 32,000 genes can be simultaneously monitored in wheat by combining the 22-kb and 11-kb oligo DNA microarrays.
Construction of a genomic library of Chinese Spring wheat with large DNA inserts
Construction of a genomic library of hexaploid wheat with large DNA inserts using a bacterial artificial chromosome is difficult because of the huge genome size (5 Gbp per genome). To efficiently screen target genes from pooled colonies and to directly transform gramineous plants with large-insert DNA, we constructed a new genomic library of Chinese Spring wheat (Liu et al. 2000).
(1) Development of an efficient maintenance and screening
system for large Insert genomic DNA libraries of hexaploid wheat in a TAC vector.
Three large-insert genomic DNA libraries of common wheat, T. aestivum cv.
Chinese Spring, were constructed in a newly developed TAC vector, pYLTAC17,
which accepts and stably maintains large genomic DNA fragments in both Escherichia
coli and Agrobacterium tumefaciens (Fig. 10). This vector contains
the cia-element required for Agrobacterium- mediated gene transfer into
grasses. The average insert sizes of the three genomic libraries were approximately
46, 65, and 120 kbp, covering three haploid genome equivalents.
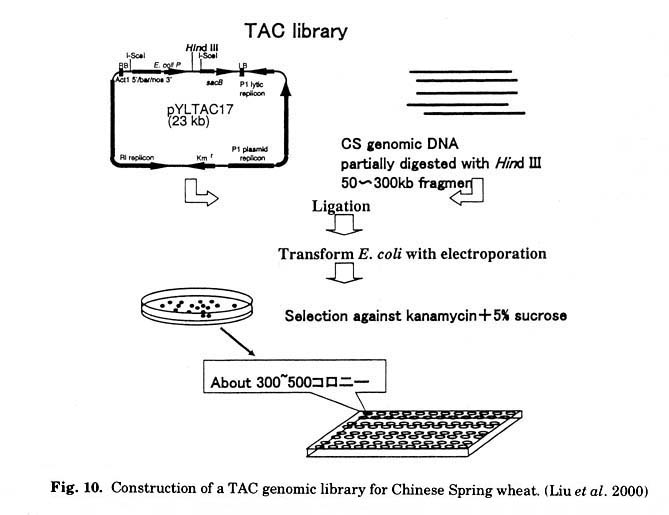
Genomic libraries were stored as frozen cultures in a 96-well format, with each well containing approximately 300-600 colonies (12 plates for a small library, 4 for a medium sized library, and 4 for a large library). In each of the libraries, approximately 80% of the colonies harbored genomic DNA inserts longer than 50 kbp. TAC clones containing gene(s) of interest were identified by pooled PCR. Once the target TAC clones were isolated, they could be immediately transferred into grass genomes with the Agrobacterium system. Five clones containing the thionin type I genes (single copy per genome), corresponding to each of the three genomes (A, B, and D), were successfully selected by pooled PCR in addition to an STS [OK] marker (aWG464; single copy per genome) and CAB (a multigene family). TAC libraries constructed as described here can be used to isolate genomic clones containing target genes and to carry out genome walking for positional cloning.
(2) Characterization and functional analysis of three
wheat genes with homology to the CONSTANS flowering time gene in transgenic
rice
TAC libraries were applied for selection of the CONSTANS (CO)
homologue in common wheat. The CO gene of Arabidopsis plays
a key role in the photoperiodic flowering pathway. To investigate photoperiod
responses in cereals in more detail, we isolated three kinds of CO /Hd1
(rice ortholog of CO) homolog derived from the A, B, and D genomes
of hexaploid wheat and designated them as TaHd1-1, TaHd1-2, and TaHd1-3,
respectively (Nemoto et al. 2003). These genes were closely
related to each other and to Hd1, and they harbored two conserved regions,
including two zinc finger motifs and a CONSTANS, CONSTANS- LIKE,
and TIMING OF CAB EXPRESSION 1 domain similar to that in CO /Hd1
. Furthermore, they were located on the long arm of homoeologous chromosome
6. TaHd1-2 harbored a 63-bp deletion in the promoter region containing
the GATA-1 box, and consequently, a subsequent transcript was not detected.
The TaHd1-1 genomic clone was introduced to a rice line deficient in
Hd1 function. Transgenic plants complemented the functions of rice Hd1;
they promoted and delayed heading under short- and long-day conditions, respectively,
indicating that Hd1 proteins from short- and long-day plants share common structures
and functions.
Conclusions
It has been believed that wheat is not suitable for studying plant molecular biology, but research tools have recently been developed for genomic studies that can be applied even to wheat. In particular, the numbers and contents of wheat ESTs have continued to grow. As of June 10, 2005, 589,498 ESTs were deposited in the dbEST database of the National Center for Biotechnology Information, which is the eighth highest among all organisms and the highest of plant species. We have contributed approximately 350,000 ESTs, which is accounts for approximately two-thirds of the total (Ogihara et al. 2003, 2005). DNA microarrays and chips based on these comprehensive ESTs are available, and the entire sequences of chloroplast and mitochondria DNA from Chinese Spring wheat are now available (Ogihara et al. 2002, 2005). Furthermore, a Chinese Spring nuclear genome sequencing project has been started (Gill et al. 2004). Due to this new information and technology, genomics of polyploidy wheat has come of age.
Acknowledgements
The author thanks Drs. Kanako Kawaura and Keiichi Mochida for their helpful discussions and continuous encouragement. The author would like to express thanks to members of the Wheat Consortium in Japan for supplying the original wheat RNAs; and to Drs. K. Murai (Fukui Prefectural University), N. Kawakami (Meiji University), E. Himi and K. Noda (Okayama University), S. Nasuda (Kyoto University), H. Miura and K Kate (Obihiro University), T. Koba (Chiba University), and S. Takumi and C. Nakamura (Kobe University). This work was supported by Grants-in-Aid for Scientific Research on Priority Areas (C) "Genome Science" and basic research (A) (Nos. 13202055 and 13356001) and by the National Bio-Resource Project from the Ministry of Education, Culture, Sports, Science and Technology of Japan.
References
Cho RJ, Mindrinos M, Richards DR, Sapolsky RJ, Anderson M, Drenkard E, Dewdney J, Reuber TL, Stammers M, Federspiel N, Theologis A, Yang WH, Hubbell E, Au M, Chung EY, Lashkari D, Lemieux B, Dean C, Lipshutz RJ, Ausubel FM, Davis RW and Oefner PJ (1999) Genome-wide mapping with biallelic markers in Arabidopsis thaliana. Nat Genet 23: 203-207.
Eisen MB, Spellman PT, Brown P0 and Botstein D (1998) Cluster analysis and display of genome- wide expression patterns. Proc Natl Aced Sci USA 95:14863-14868.
Ewing M, Kahla AB, Poirot 0, Lopez F, Audic S and Claverie JM (1999) Large-scale statistical analyses of rice ESTs reveal correlated patterns of gene expression. Genome Res 9: 950-959.
Gill BS, Appels R, Botha-Oberholster AM, Buell CR, Bennetzen JL, Chalhoub B, Chumley F, Dvorak J, Iwanaga M, Keller B, Li W, McCombie WR, Ogihara Y, Quetier F and Sasaki T (2004) A workshop report on wheat genome sequencing: International genome research on wheat consortium. Genetics 168:1087-1096.
Hoogendoorn B, Owen MJ, Oefner PJ, Williams N, Austin J and O'Donovan MC (1999) Genotyping single nucleotide polymorphisms by primer extension and high performance liquid chromatography. Hum Genet 104: 89-93.
Kawaura K, Mochida K, Yamazaki Y and Ogihara Y (2005) Transcriptome analysis of salinity stress responses as revealed by the 22k oligo DNA microarray in common wheat (submitted).
Kihara H (1954) Consideration on the evolution and distribution of Aegilops species based on the analyzer-method. Cytologia 19: 336-357.
Lange C and Whittacker JC (2001) On prediction of genetic values in marker-assisted selection. Genetics 159: 1375-1381.
Leitch IJ and Bennett MD (1997) Polyploidy in angiosperms. Trends Plant Sci 2: 470-476.
Lilienfeld FA (1951) H Kihara: Genome analysis in Triticum and Aegilops. X. Concluding review. Cytologia 16:101-123.
Liu YG, Nagaki K, Fujita M, Kawaura K, Uozumi M and Ogihara Y (2000) Development of an efficient maintenance and screening system for large-insert genomic DNA libraries of hexaploid wheat in a transformation-competent artificial chromosome (TAC) vector. Plant J 23: 687-695.
Makridakia NM and Reichardt JKV (2001) Multiplex automated primer extension analysis: Simultaneous genotyping of several polymorphisms. BioTechniques 31: 1374-1380.
Masterson J (1994) Stomatal size in fossil plants: evidence for polyploidy in the majority of angiosperms. Science 264: 421-424.
Mochida K, Yamazaki Y and Ogihara Y (2003) Discrimination of homoeologous gene expression in hexaploid wheat by SNP analysis of contigs grouped from a large number of expressed sequence tags. Mol Gen Genomics 270:371-377.
Mochida K, Kawaura K, Shimosaka E, Shin-IT, Kohara Y, Yamazaki Y and Ogihara Y (2005) Tissue expression map of comprehensive expressed sequence tags and its application to in silico screening of stress response genes in common wheat. (submitted)
Nemoto Y, Kisaka M, Fuse T, Yano M and Ogihara Y (2003) Characterization and functional analysis of three wheat genes with homology to the CONSTANS flowering time gene in transgenic rice. Plant J. 36: 82-93.
Ogihara Y and Ohsawa T (2002) Molecular analysis of the complete set of length mutations found in the plastomes of Triticum-Aegilops species. Genome 45: 956-962.
Ogihara Y and Tsunewaki K (1988) Diversity and evolution of chloroplast DNA in Triticum and Aegilops as revealed by restriction fragment analysis. Theor Appl Genet 76: 321-332.
Ogihara Y, Terachi T and Sasakuma T (1988) Intramolecular recombination of chloroplast genome mediated by short direct repeat sequences in wheat species. Proc Natl Acad Sci USA 85: 8573-8577.
Ogihara Y, Futami K, Tsuji K and Mural K (1997) Alloplasmic wheats with Aegilops crassa cytoplasm which express photoperiod-sensitive homeotic transformations of anthers, show alterations in mitochondrial DNA structure and transcription. Mol Gen Genet 255: 45-53.
Ogihara Y, Isono K, Kojima T, Endo A, Hanaoka M, Shiina T, Terachi T, Utsugi S, Murata M, Mon N, Takumi S, Ikeo K, Gojobori T, Murai R, Murai K, Matsuoka Y, Ohnishi Y, Tajiri H and Tsunewaki K (2002) Structural features of a wheat plastome as revealed by complete sequencing of chloroplast DNA. Mol Genet. Genomics 266: 740-746.
Ogihara Y, Mochida K, Nemoto Y, Mural K, Yamazaki Y, Shin-I T and Kohara Y (2003) Correlated clustering and virtual display of gene expression patterns in the wheat life cycle by large-scale statistical analyses of expressed sequence tags. Plant J 33: 1001-1011.
Ogihara Y, Mochida K, Kawaura K, Murai K, Seki M, Kamiya A, Shinozaki K, Carninci P, Hayashizaki Y, Shin-IT, Kohara Y and Yamazaki Y (2004) Construction of a full-length cDNA library from young spikelets of hexaploid wheat and its characterization by large-scale sequencing of expressed sequence tags. Genes Genet Syst 79: 227-232.
Ogihara Y, Yamazaki Y, Murai K, Kanno A, Terachi T, Shiina T, Miyashita N, Nasuda S, Nakamura C, Mon N, Takumi S, Murata M, Futo S and Tsunewaki K (2005) Structural dynamics of cereal mitochondrial genomes as revealed by complete nucleotide sequencing of the wheat mitochondrial genome. Nucleic Acids Res (in press)
Ozkan H, Levy AA and Feldman M (2001) Allopolyploidy-induced rapid genome evolution in the wheat (Aegilops-Triticum) group. Plant Cell 13: 1735-1747.
Rickert AM, Premstaller A, Gebhardt C and Oefner PJ (2002) Genotyping of SNPs in a polyploid genome by Pyrosequencing. BioTech 32: 592-603.
Sasaki, T (2003) Rice genome analysis: Understanding the genetic secrets of the rice plant. Breed. Sci. 53, 281-289.
Scheid OM, Probst AV, Afsar K and Paszkowski J (2002) Two regulatory levels of transcriptional gene silencing in Arabidopsis. Proc NatI Acad Sci USA 99: 13659-13662.
Shaked H, Kashkush K, Ozakn H, Feldman M and Levy AA (2001) Sequence elimination and cytosine methylation are rapid and reproducible responses of the genome to wide hybridization and allopolyploidy in wheat. Plant Cell 13: 1749-1759.
Soltis PS and Soltis DE (2000) The role of genetic and genomic attributes in the success of polyploids. Proc Natl Acad Sci USA 97: 7051-7057.
Tsunewaki K (1993) Genome-plasmon interaction in wheat. Jpn J Genet 68: 1-34.
Van Campenhout S, Sagi L, Vander Stappen J and Volckaert G (1998) Characterization of type-I thionin loci from the A, B, D and R genomes of wheat and rye. Theor Appl Genet 96: 80-86.
Vision TJ, Brown DG and Tanksley SD (2000) The origins of genomic duplications in Arabidopsis. Science 290:2114-2117.
Wendel JF (2000) Genome evolution in polyploids. Plant Mol Biol 42: 225-249.
Yu J, Hu S, Wang J, Wong GK, Li S, Liu B, Deng Y, Dai L, Zhou Y, Zhang X, Cao M, Liu J, Sun J, Tang J, Chen Y, Huang X, Lin W, Ye C, Tong W, Cong L, Geng J, Han Y, Li L, Li W, Hu G,Huang X, Li W, Li J, Liu Z, Li L, Liu J, Qi Q, Liu J, Li L, IA T, Wang X, Lu H, Wu T, Zhu M, Ni P, Han H, Dong W, Ren X, Feng X, Cui P, Li X, Wang H, Xu X, Zhai W, Xu Z, Zhang J, He S, Zhang J, Xu J, Zhang K, Zheng X, Dong J, Zeng W, Tao L, Ye J, Tan J, Ren X, Chen X, He J, Liu D, Tian W, Tian C, Xia H, Bao Q, Li G, Gao H, Cao T, Wang J, Zhao W, Li P, Chen W, Wang X, Zhang Y, Hu J, Wang J, Liu S, Yang J, Zhang G, Xiong Y, IA Z, Mao L, Zhou C, Zhu Z, Chen R, Hao B, Zheng W, Chen S, Guo W, Li G, Liu S, Tao M, Wang J, Zhu L, Yuan L and Yang H (2002) A draft sequence of the rice genome (Oryza sativa L. ssp. indica). Science 296: 79-92.