Memorial Issue, Wheat Information Service No. 100
Structural organization of the wheat genome
Kulvinder S. Gill
Department of Crop and Soil Sciences, Washington State University, Pullman,
WA 99164 6420, USA
E-mail address: ksgill@mail.wsu.edu
Key words: gene distribution, recombination, gene-rich regions, physical maps, linkage maps, chromosome analysis, wheat, kb/cM
Introduction
Wheat belongs to the grass family Poaceae that also includes other major crop plants such as barley, oats, rice and maize. The genome size difference within the Poaceae family can be as large as 35-fold, as observed between wheat (Triticum aestivum L.) (16,000 Mb) and rice (410 Mb). Discounting polyploidy, this difference is about 12-fold. The rice genome is only about three times larger than the genome of the model pl ant Arabidopsis. This disparity in genome size of organisms of similar biological complexity such as plants, is due primarily to non-transcribing repeated DNA that is mainly composed of retrotransposons and pseudogenes. Because of the larger genome size, only a small fraction of the wheat genome is expected to contain genes. Estimates for the gene-containing fraction of the wheat genome range from 1-5% obtained from the available sequence data analyses and genome size comparisons with other plant genomes, to 15% by DNA re-association kinetics experiments. Gene distribution in wheat and other cereals is highly uneven along the chromosomes. It is, therefore, imperative to identify and demarcate the gene-containing regions for an efficient and targeted characterization of the genome. This paper will show the location and demarcation of the gene containing regions on the wheat chromosomes. Secondly, recombination is usually used as a measure of distance between markers and genes of interest. A precise estimate of recombination at a sub-chromosomal level is mandatory for any recombination-based gene cloning approach. It is now established that recombination is unevenly distributed along the chromosomes of cereals and other higher eukaryotes. Therefore, a detailed description of recombination distribution on wheat chromosomes and its relationship with the distribution of genes is also presented in this paper.
Gene distribution in wheat
Among the poorly sequenced plants, distribution of genes is the best known for the wheat genome. In order to identify and demarcate the gene-containing regions, precise physical location of 3,025 gene marker loci including 252 phenotypically characterized genes and 17 quantitative trait loci (QTLs), was revealed relative to 352 deletion breakpoints (Erayman et al. 2004). Wheat is an allohexaploid containing three genomes that originated from a common progenitor (Kihara 1944; McFadden and Sears 1946). Although subtle differences do exist, gene synteny and colinearity appear to be conserved among the wheat homoeologs at the current resolution. This conservation made it possible to generate consensus physical map for each of the wheat homoeologous chromosome groups by combining information from the three homoeologs in order to localize gene markers to the smallest possible chromosomal intervals. The average number of deletion breakpoints per homoeolog was 48 with a range of 40 to 58. These consensus physical maps revealed the gene-containing regions and identified the flanking deletion breakpoints. The physical consensus maps were compared with the corresponding consensus genetic linkage maps that were generated by combining information from 137 existing wheat maps (Erayman et al. 2004). This comparison revealed physical location of 252 phenotypically characterized genes, confirmed gene distribution, and provided estimates of recombination at a sub chromosomal level.
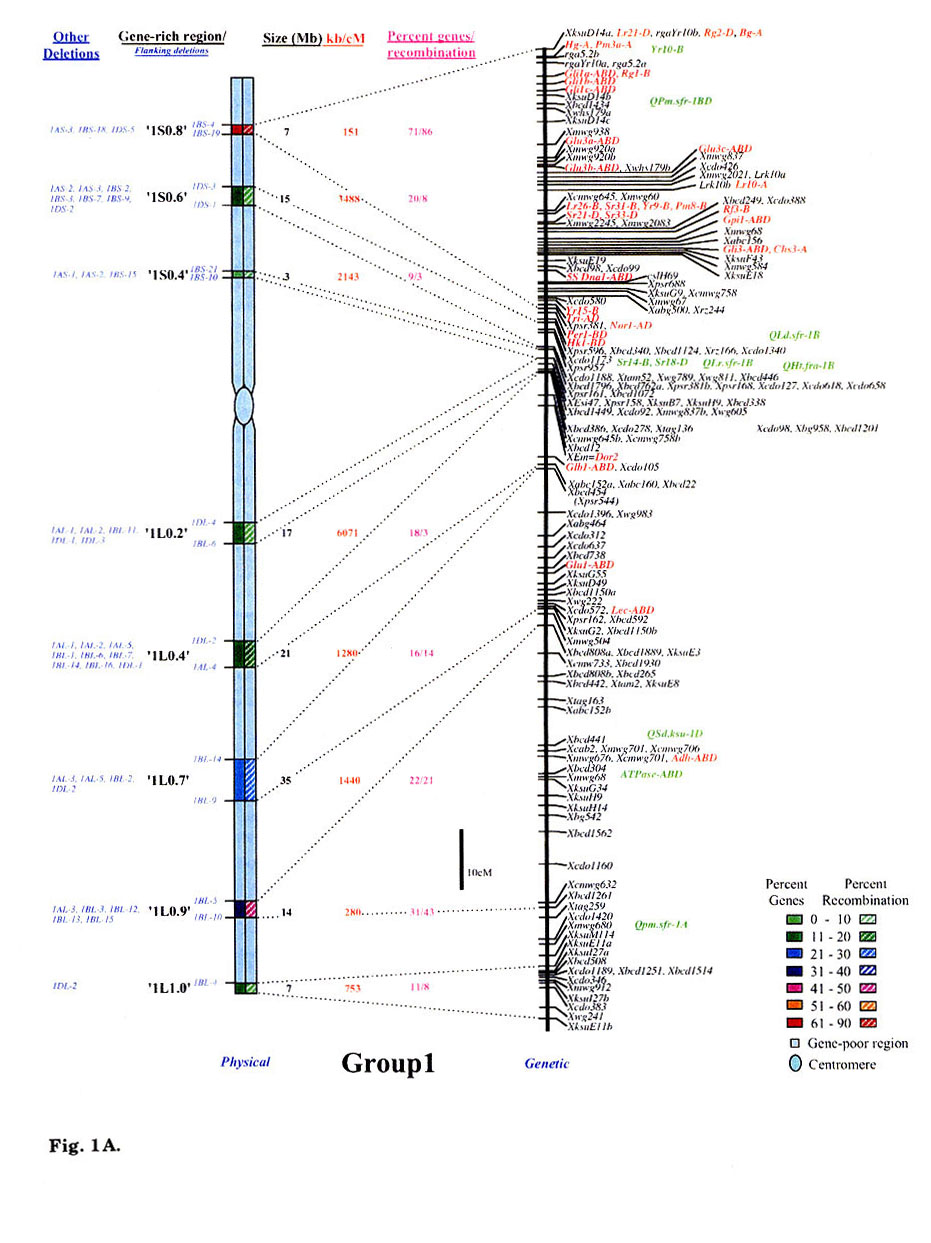
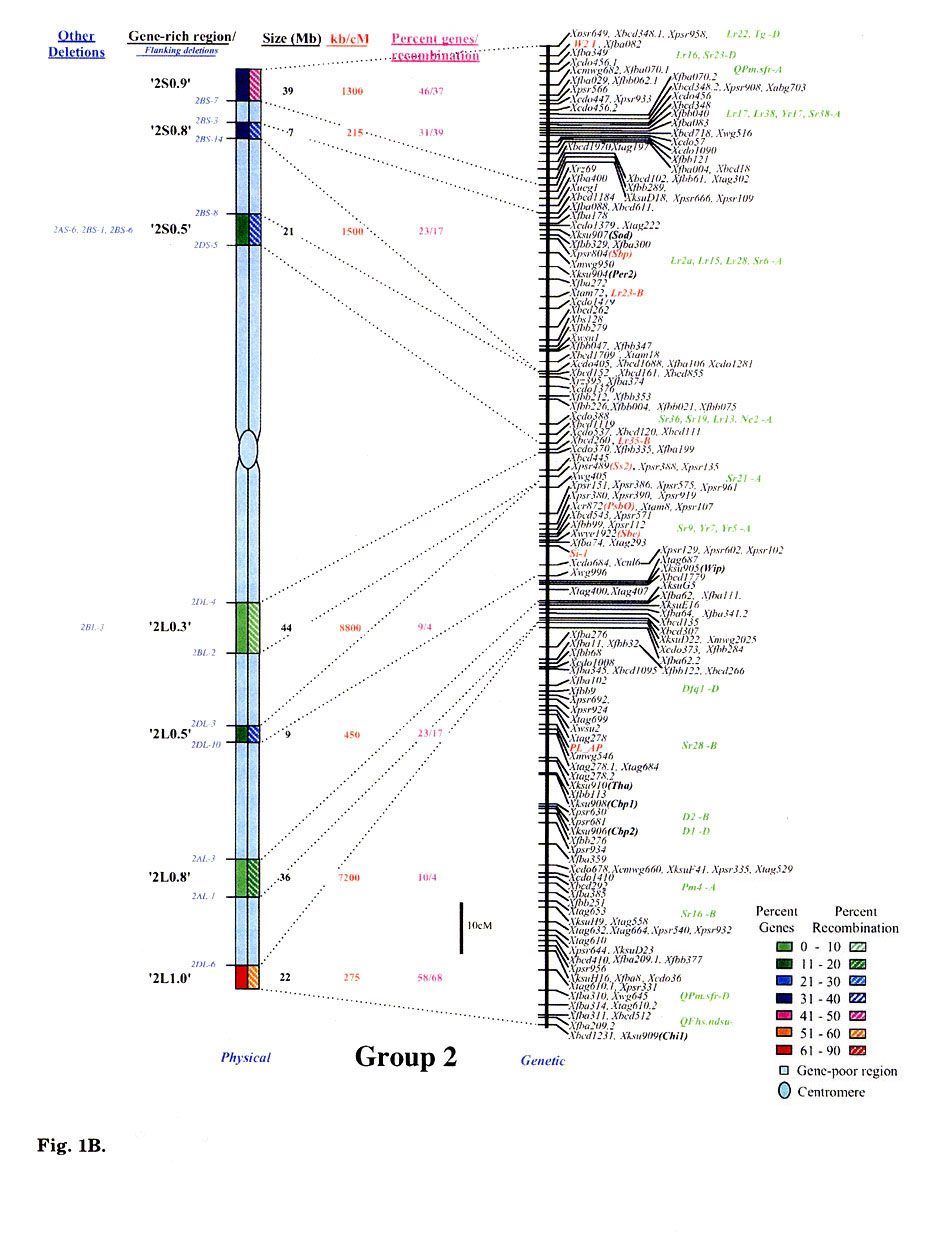
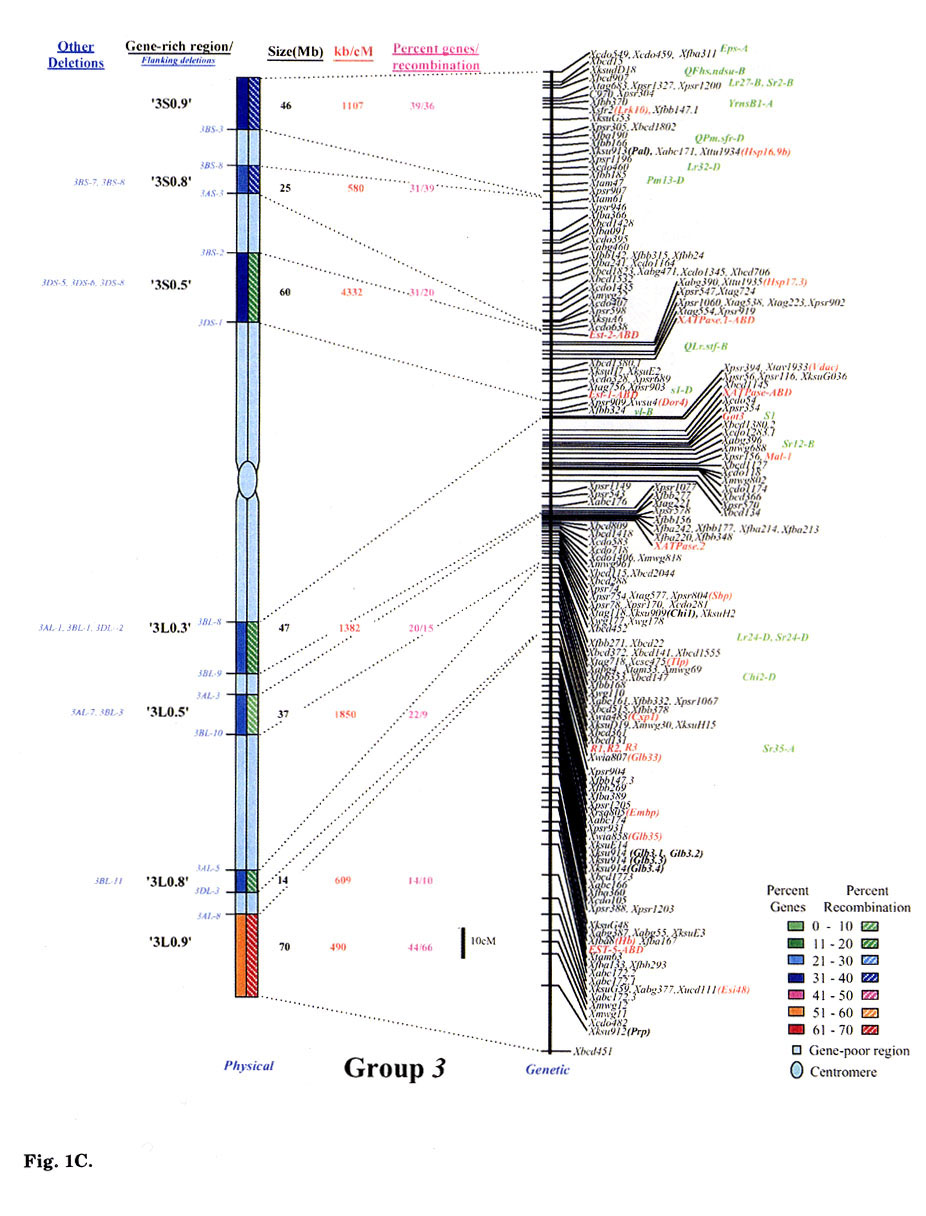
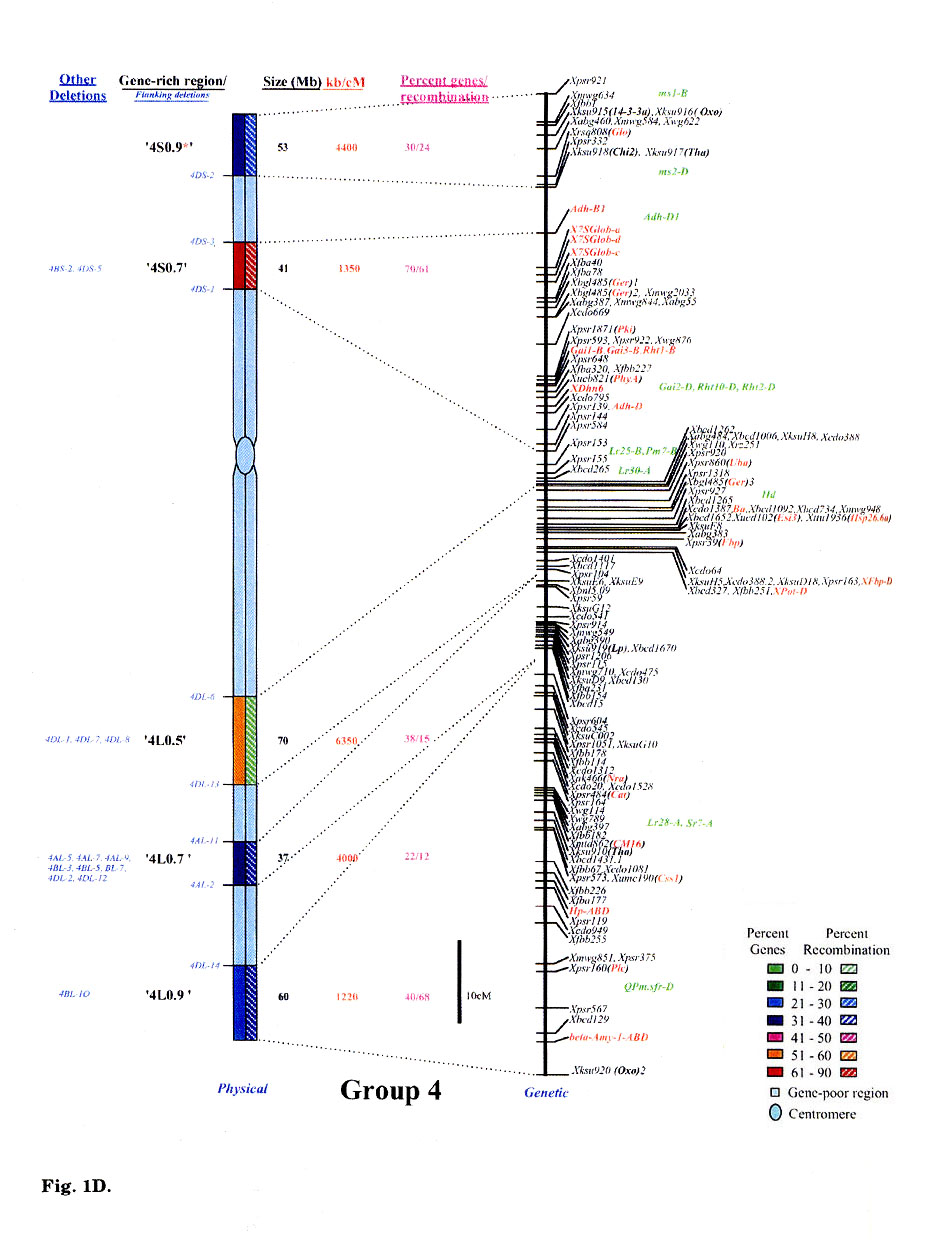
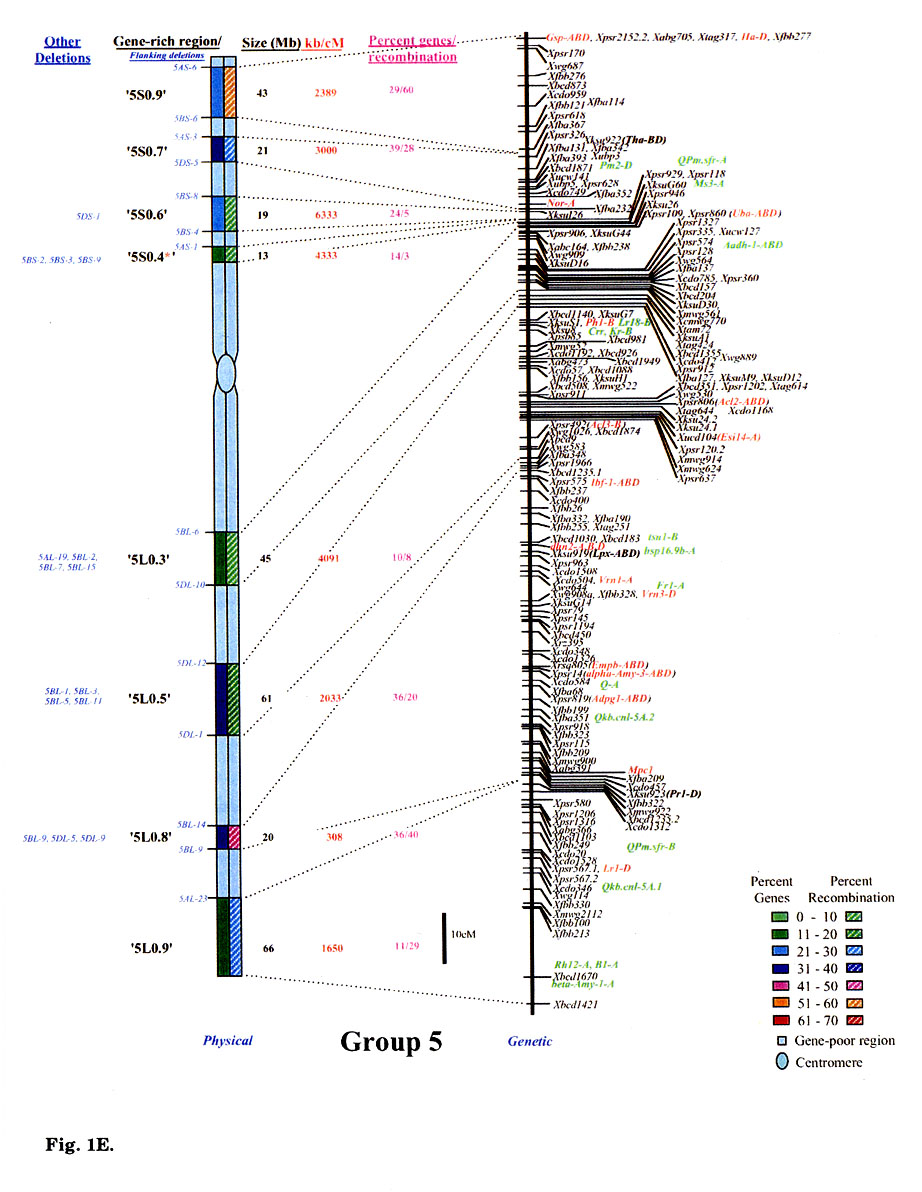
Gene distribution on the wheat chromosomes is obvious from Fig. 1 (A to G). Regions of very high marker density were observed on all consensus physical maps and were called gene-rich regions (GRRs). The location and size of each GRR was drawn to scale and the bracketing deletion breakpoints are shown on the 'left'. Other information about the bracketing deletions, size, markers and other deletion lines for each GRR, is also given. With an average of about seven and a range of five to eight per chromosome, 48 GRRs were identified on the wheat chromosomes. The GRRs were named according to their location on the chromosome. For example, the GRR '1SO.4' is present on the short arm of chromosome 1 at a fraction length (FL) location of 0.4 (Fig. 1A). The 48 GRRs contained about 94% of the gene markers. The remaining 6% of the markers were present in the other regions. Of the 252 phenotypically characterized genes, 241 mapped in the GRRs. All 17 QTLs that were present on the consensus genetic linkage maps, also mapped in the GRRs.
Fig. 1.
Comparison of consensus physical maps with the consensus genetic linkage maps
of wheat (A to G for homoeologous group 1 to 7, respectively). The size of consensus
chromosomes, the location and the sizes of the GRRs are drawn to scale based
on the average size of the three homoeologous chromosomes Gill et al.
1991). Names of the GRRs are given on the left side of the consensus physical
maps. In the nomenclature of the GRRs (e.g. '1SO.8'), the first digit represents
wheat homoeologous group followed by the arm location as short arm (S) or long
arm (L). The last two numerals represent fraction length of the GRR location.
The flanking and other deletion lines around the region for each GRR are shown
in blue on the left side of consensus physical chromosome. Actual physical size,
the ratio of physical to genetic distance, and percent genes/recombination for
each region are given on the right hand side of the consensus chromosome. Sizes
(in Mb) of GRRs were calculated based on the cytological measurements. Recombination
in a chromosomal region was calculated by comparing deletion line based physical
map with the consensus genetic linkage map for each chromosome. Flanking markers
for each GRR are joined with dotted lines in physical and consensus genetic
linkage maps. On the consensus genetic linkage maps, the genes for which exact
location in reference to other markers was known, are shown in red and the genes/QTLs
for which the location was approximate, are shown in green. The markers shown
in bold were physically mapped using deletion lines. fraction length for satellite.
Φ region not precisely marked by deletion lines.Ψ, markers, which
were not flanked by the flanking deletion lines for the GRR but probably, are
part of that region. This figure is modified from that published by Erayman
et al. (2004).
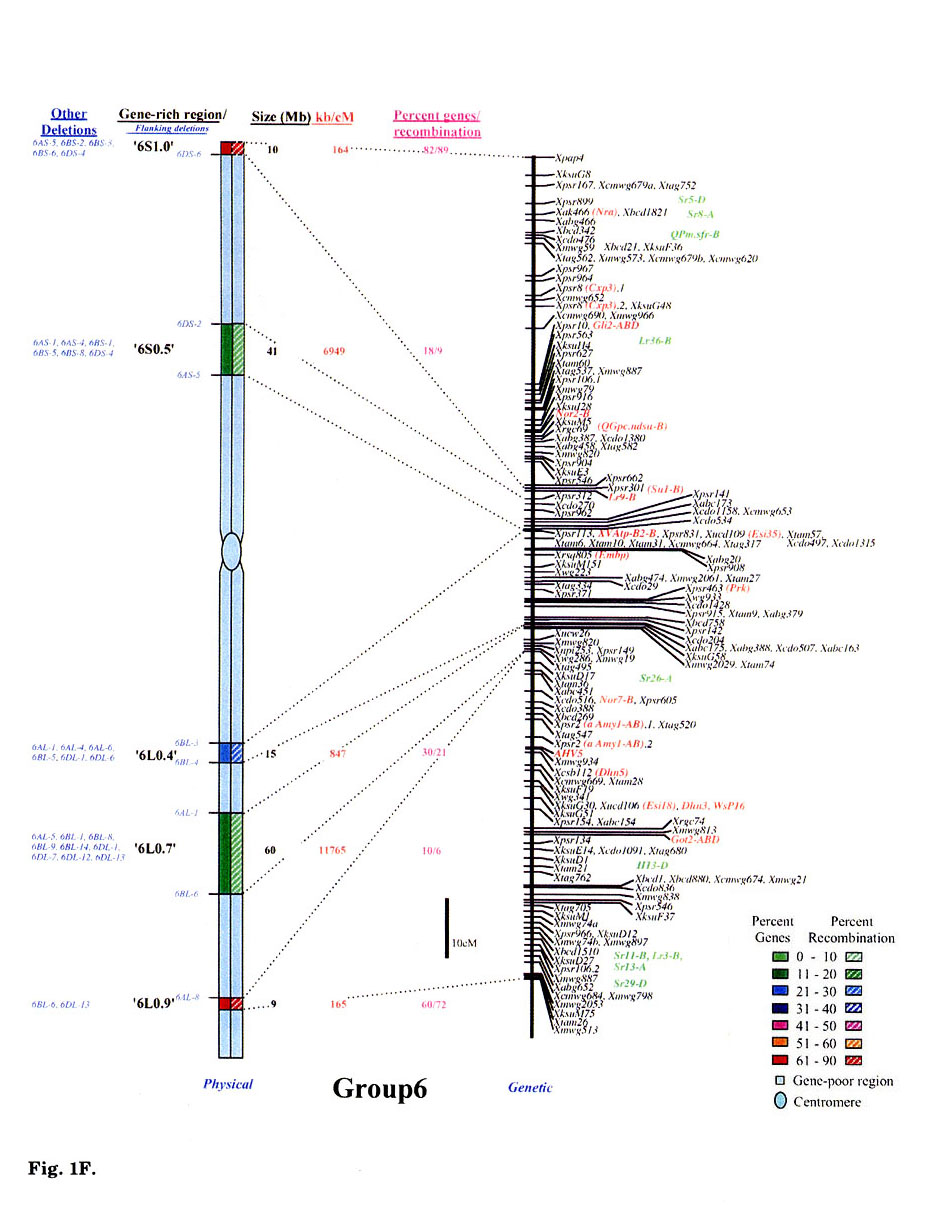
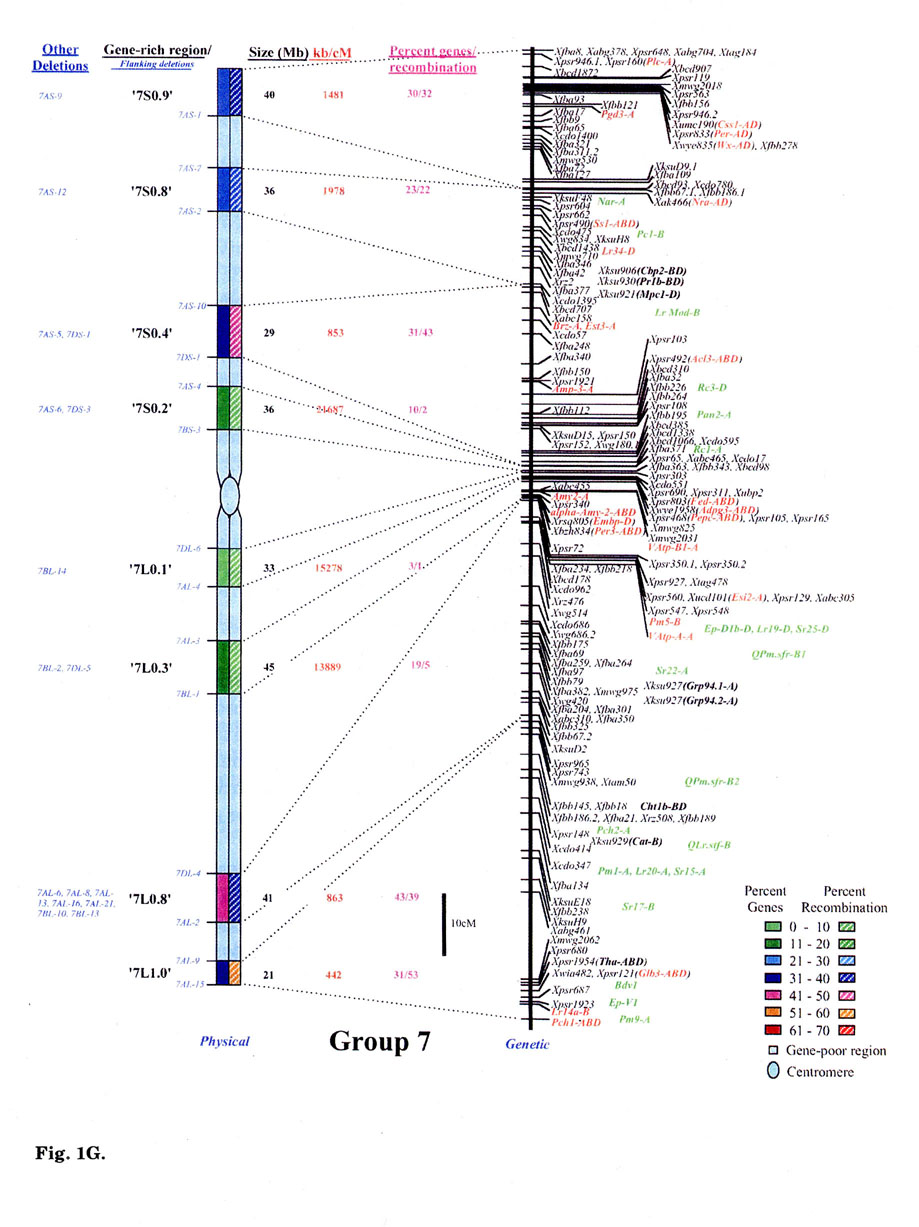
Wheat chromosomes differed for the number and location of GRRs (Fig. 1). Twenty- one GRRs were present on the short arms and contained 35% of the wheat genes. The remaining 27 GRRs were present on the long arms and contained about 59% of the genes. The number of GRRs per chromosome varied from five (Group 4 and 6) to eight (Group 1, 5, and 7). Essentially no GRR was observed in the centromeric regions of the chromosomes. Only one small GRR ('7L0.1') containing 4% of the arm's genes was observed in the proximal 20% of any chromosome (Fig. 1G). In general, GRRs present in the distal regions were relatively higher in gene-density. More than 80% of the total marker loci mapped in the distal half of the chromosomes and about 58% mapped in the distal 20%.
Significant differences were observed among GRRs for the size, and the marker number and density. The 48 GRRs encompassed about 1,554 Mb that is equivalent to approximately 29% of the wheat genome. Gene density and number in 18 GRRs was very high (major GRRs) (Fig. 1). These major GRRs contained about 60% of the wheat genes but covered only about 11% of the genome. The gene number and density was variable even among these major GRRs. Five of these 18 GRRs ('1S0.8', 2L1.0', '4S0.7', '6S1.0', and '6L0.9') contained 26% of the wheat genes but spanned only about 3% of the genome. On the contrary, four minor GRRs ('1S0.4', '2L0.3', '5S0.4', and '7L0.1') contained only about 2% of the wheat genes but covered more than 2% of the genome. Estimated size of GRRs varied from 3 Mb for '1S0.4' to 71 Mb for '3L0.9', with an average of 32 Mb. The total region spanned by GRRs on a chromosome ranged from 119 Mb for group 1 to 288 Mb for group 5. Number of genes in a GRR varied from 4% of the arm in '7L0.1' to 82% in'6S1.0'. Gene density varied as much as 70 folds among GRRs with a range from a gene per 78 kb in '1S0.8' to, 5,500 kb in '7L0.1'. Gene distribution even within the GRRs appeared to be uneven. The '1LO.9' region is present between FLs 0.84 and 0.90. Of the total 22 markers present in the region, 16 mapped between FL 0.84 and 0.85, one between FLO.85 and 0.89, and five between FL 0.89 and 0.90.
No correlation was observed between the chromosome size and the gene fraction or the size of the GRRs. For example, group 3 has the largest chromosomes among the wheat homoeologous groups but contained only 13% of the genes compared to group 5 chromosomes that contained 20%. The gene fraction seemed to correlate with the size of the GRRs. The size of chromosomes encompassing the GRRs is the largest for group 5 and the smallest for group 6. Correspondingly, the gene fraction was the highest for group 5 and the lowest for group 6.
Physical and genetic location of 269 phenotypic markers is shown in Fig. 1 that include 80 single-gene-inherited wheat disease resistance genes and 17 QTLs. Some of the other useful genes were: Eps (earliness per se), Hd (awnedness), Kr (crossibility), Ph1 (pairing of homoeologues 1), plant height, male sterility and ear morphology genes. Of the 269 phenotypic markers and useful genes, 159 were reliably located on the consensus genetic maps (colored red, Fig. 1). The remaining 93 genes were placed on the consensus genetic maps because of their close association (<5 cM) with one or more markers. The 17 QTLs were located to 10 cM intervals on the consensus linkage map as their precise location within the intervals was not known. These 93 genes and 17 QTLs are colored green in Fig. 1A to 1G. Comparison of the genetic with the physical consensus map localized 258 of the 269 phenotypic markers and useful genes to the GRRs. Eleven genes: —Per1, Hk1, Lr35, Xksu9O5 (Wip), Lr25, Lr9, Pm7, Lr30, Xwsu4 (Dor4), tav1933 (Vdoc), and v1- did not map in the GRRs.
With an average of 36, the number of phenotypic markers varied from 29 for group 4 to 44 for group 1. Thirty-seven GRRs contained the phenotypic markers. The 11 GRRs that lacked phenotypic markers were present in the proximal regions of the chromosomes (Fig. 1). The highest number (32) of phenotypic markers was observed for the '1S0.8' region (Fig. 1A).
Gene distribution in grasses and other eukaryotes
As observed in wheat, distribution of genes is uneven in other grass species as well. Even in the smaller rice genome, ∼20% of the genome has not been contiged / sequenced in spite of extensive efforts (Wu et al. 2002). Gene distribution is highly uneven even in the remaining 80% of the genome. Mapping of 6,591 unique ESTs on yeast artificial chromosome (YAC) - based contiguous map revealed that 21% of the genome contained 40% of the genes (Wu et al. 2002). The difference in gene density among various regions was more than 10-fold.
Translocation breakpoint-based physical maps showed that barley chromosomes are also partitioned into gene-rich and gene-poor regions (Kunzel et al. 2000). The location and relative gene-density in barley is very similar to that in wheat although some subtle differences were observed. Similarly, gene-density revealed by sequencing ∼200 kb around well-characterized genes strongly suggests that the gene distribution is uneven in maize and sorghum also (Chen et al. 1998; Feuillet and Keller 1999; Tikhonov et al. 1999).
Uneven distribution of genes on chromosomes seems to be a common feature of all eukaryotes. Even in Saccharomyces cerevisiae, gene-density among regions may vary more than 2-fold (Dujon et al. 1997). For example, in chromosome XV, gene-density varied from <0.4 to 0.85. Similarly, in the smaller genome plant Arabidopsis, genes are asymmetrically distributed on the chromosomes. About 45% of the genome accounts for the 25,000 genes with an average size of∼2 kb. The remaining 55% is 'gene-empty' and is interspersed among genes ranging in size from few 100 bp to about 50 kb (TAGI 2000). The human genome is relatively large and the partitioning into gene-rich and gene-poor regions is more distinct (IHGSC 2001; Venter et al. 2001). The 30,000 genes with an average size of 27 kb account for about 25% of the human genome. The remaining 75% is retrotransposon-like repetitive DNA interspersed among genes with varying sized blocks.
What are the gene-rich regions?
Based on the estimate that only about 1-5% of the wheat genome contains genes, only 3-18% of the GRRs should represent genes. Although the exact distribution of genes and recombination within the GRRs is not yet known, preliminary sequence data from wheat and detailed analysis of sequence data from model plants Arabidopsis and rice, suggest that the GRRS are further partitioned into 'mini' gene-rich and gene-poor compartments. In the eukaryotes studied so far, genes are interspersed by 'gene-empty' regions, the number and size of which seem to be proportional to their genome size. About 82% of the yeast genome contains genes (Mewes et al. 1997). About 90% of the genes are present in clusters of size ranging from 10 to 450 kb (Bussey et al. 1997; Dujon et al. 1997). The interspersing 'gene-empty' regions are up to 20 kb in size. In Arabidopsis, about 45% of the genome contains genes. The remaining 'gene-empty' part is interspersed among genes with an average size of ∼2.4 kb and ranging up to ∼4 Mb (TAGI 2000). The human is the largest genome sequenced where the genes account for only -25%. The size of the 'gene-empty' regions can be up to 30 Mb with an average of-80 kb (IHGSC 2001).
Among grasses, rice and barley are diploids belonging to the same tribe, Triticeae. The two genomes however differ in size by 12-fold. In rice, a gene is expected to occur every 16 kb, assuming 25,000 randomly distributed genes. Mapping of 6,591 unique ESTs on yeast artificial chromosome (YAC) contigs of rice revealed 300-500 kb regions of high gene-density with a gene every ∼4 kb (Wu et al. 2002; Sidhu and Gill 2004; http:// rgp.dna.affrc.go.jp/ Publicdata.html). These regions were more prevalent in the distal parts of the chromosomes and the gene-density even within these regions was highly uneven. The size of the interspersing 'gene-empty' regions ranged from 1 to 30kb. Clustering of genes is more pronounced in larger genomes such as barley, where the presumed 30,000 genes are expected to occur one every 166 kb. However, analysis of 1.1 Mb sequence from 12 different gene-containing regions showed a gene every 21 kb (Panstruga et al. 1998; Feuillet and Keller 1999; Shirasu et al. 2000; Dubcovsky et al. 2001; Fu et al. 2001, 2002; Rostoks et al. 2002; Wei et al. 2002). The gene distribution within these regions was also highly uneven, with the interspersing 'gene-empty' block size ranging from 0.8 kb to 94 kb. As observed in rice, localized regions of high gene density (a gene every 4.4 kb) were also observed in barley. The average size of the high gene-density regions seems to be smaller than that of rice. Among the 12 regions sequenced, the largest contig is 261 kb around the Mla locus (Wei et al. 2002). A 130 kb region of this contig contained 23 genes with an average gene-density of 5.6 kb. Even within this region, the size of 'gene-empty' regions ranged from few hundred bps to 11kb. The second region of high gene-density was ∼40 kb long and contained 10 genes (a gene every 4 kb). The largest 'gene-empty' region was 5.5 kb. Another 60 kb barley contig spanned a 32 kb region around the bronze locus with a gene every 3.2 kb (Fu et al. 2001). Similar observations were made in other large genome grasses such as Triticum monococcum, Aegilops tauschii, and maize (Rahman et al. 1997; Feuillet and Keller 1999; Tikhonov et al. 1999; Wicker et al. 2001).
The main change from the smaller (Arabidopsis and rice) to the larger genome plants (wheat, barley, and maize) is the overall reduction of the gene-duster size and expansion of the interspersing 'gene-empty' regions. The average gene-density within the smaller gene-clusters is similar at least among plants. The average size of the gene dusters among plants seems to be inversely related to the genome size. The average size of gene clusters in rice is ∼300 kb compared to wheat and barley where it seems smaller than 50 kb. The 'gene-empty' regions seem to amplify preferentially, as is obvious in wheat where large, essentially 'gene-empty' blocks of up to ∼192 Mb are common. The current demarcation of the gene-rich and gene-poor regions has perhaps identified these larger 'gene-empty' regions of wheat. Taking polyploidy into account, the 30% gene-rich part of the genome is still ∼4 times larger than the entire rice genome (Erayman et al. 2004). Therefore, gene distribution within the currently defined GRRs of wheat would probably be similar to that in the rice genome, except that the gene clusters would be smaller and the interspersing 'gene-empty' regions would be larger, similar to barley as described above.
Recombination on the wheat chromosomes
Comparison of the consensus physical and genetic linkage maps via 428 common markers provided a detailed and accurate estimate of recombination at a sub-region level. In general, a severe suppression of recombination was observed in the centromeric regions of the wheat chromosomes (Fig. 1). One-fourth of the wheat genome present around the centromeres accounted for <1% of the total recombination. Almost a perfect linkage among markers present on different arms of a chromosome was observed. For example, markers Xcdo618 ('1S0.4') and Xcdo98 ('1LO.2') were physically separated by 1/4th of the chromosomal length but were less than 2 cM apart on the consensus genetic linkage map. This observation was consistent for all wheat chromosomes. Due to the lack of recombination in the proximal regions, a large number of markers appeared to be clustered in the centromeric regions of the linkage maps (Fig. 1A to G).
Essentially no recombination was observed in the gene-poor regions. The gene-poor regions accounted for only ∼5% of the recombination. Markers present in two different GRRs separated by a gene-poor region were usually tightly linked on the genetic linkage map. For example, no recombination was observed between markers Xwg789 ('1SO.6') and Xcdo6l8 ('1SO.4'). Similarly, markers XksuD22 ('2L0.8') and Xcdo373 ('2L1.0') were inseparable on the genetic linkage map even though these were present in different GRRs in the distal parts of the chromosome and separated by about 20% of the arm length (Fig. 1). Maximum recombination observed in a gene-poor region was for the region between '4S0.9' and '4S0.7' that accounted for about 12% of the arm's recombination. About 95% of the recombination occurred in the GRRs (Fig. 1). Among GRRs, maximum genetic length of 143 cM was observed for '3L0.9' and minimum of 1 cM was for '1SO.4' region. Recombination rate for two GRRs ('7L0.1' and '7L1.0') present on the same chromosome arm was 53-fold different. Only 1-3% of the arm's recombination was observed for the GRES '1LO.2' and '7L0.1'.
Recombination in the distal regions was much higher as compared to the proximal half of the chromosomes. The recombination rate among GRRs present in the distal half of the chromosomes was, however highly variable. Suppressive effect of centromere on recombination was not observed in the distal parts of the chromosomes. Recombination rate in some proximal GRRs was higher than in distal GRRs. For example, '1L0.9' region is proximal to '1L1.0' but is ∼5-fold higher in recombination (Fig. 1A). There are six other examples where recombination in the proximal GRRs is 38 to 325% higher compared to the distal GRRs (Fig. 1A to G).
In general, recombination rate in the smaller GRRs seemed higher as compared to the GRRs that encompassed larger chromosomal regions. For example, the 10 Mb sized region '6S1.0' had the highest percent recombination per chromosome arm. Similarly, the '1SO.8' region showed 86% of the arm's recombination and is only about 7 Mb in size. On the other hand, one of the largest GRR '4L0.5', is about 70 Mb but accounted for less than 15% of the arm's recombination (Fig. 1D). This pattern of negative correlation between GRR size and recombination rate was not observed for some regions as in the case of '3L0.9' (Fig. 1C).
Comparisons of consensus physical and genetic linkage maps showed that the ratio of physical to genetic distance (kb/cM) varied as much as 140-fold among GRRs. The kb/cM estimate ranged from 151 for '1SO.8' to 21,687 for '7S0.2' with an average of 3,381 (Fig. 1A and G). In most cases recombination rate was higher for GRRs with a higher gene density although there were some exceptions. For example, gene density was relatively high in the GRR '1SO.4' (1 gene / 273 kb) but only 3% of the arm's recombination was observed in this region. Similarly, '5S0.9' region is relatively low in gene density (1 gene/ 2,688 kb), but 60% of the arm's recombination occurred in this region.
The extent of recombination per chromosome seems to be independent of chromosome size. The average recombination in yeast is ∼262 cM/chromosome, with an average chromosome size of ∼0.75 Mb (http://genome-www.stanford.edu/Saccharomyces). Similar values for nee and human are 127 and 154 cM/chromosome, respectively (Wu et al. 2002; http:///rgp.dna.affrc.go.jp/Publicdata.html; http://www.ncbi.nlm.nih.gov). The human chromosomes are about four times larger than that of rice. The chromosomes of wheat are >1000-fold larger than that of yeast but average recombination per chromosome is about the same (Gill et al. 1991; Erayman et al. 2004). Extent of recombination also depends upon the evolutionary distance between the two parents of the mapping population. Lower rate of recombination per chromosome reported in some crop plants maybe due to inter specific mapping populations that were developed to maximize polymorphism. Pairing and subsequent recombination between chromosomes of different species is significantly less than in inbreds (Kimber 1970; Dvorak and Chen 1984).
Uneven distribution of recombination has been observed along chromosomes of all eukaryotes studied so far (Dvorak and Chen 1984; Bollag et al. 1989; Curtis and Lukaszewski 1991; Gill et al. 1993; Lichten and Goldman 1995; Gill et al. 1996a, b; Tranquilli et al. 1999; Sandhu and Gill 2002a, b; Akhunov et al. 2003). Distribution of recombination is best studied on yeast chromosomes. Measured at 1 kb resolution, the average frequency of recombination is about 0.35 cM per kb with a range of 0 to 2 cM ( http://genome www.stanford.edu/Saccharomyces). Among cereals, the rice genome is one of the smallest. Average frequency of recombination in rice is about 3 cM per Mb with a range of 0 to 60 cM (Sidhu and Gill 2004, for review). Non-recombinogenic regions were observed in yeast as well as in rice, but the highest amount of recombination for a region appears to be ∼35-fold less in rice. It may be because the rice estimates were at ∼400 kb resolution, whereas the recombination hotspots may only be < 1kb in length. Due to averaging over a larger region, recombination in hotspots may appear less in rice compared to that in yeast. Average recombination frequency in human is 1 cM per Mb with a range from 0 to 4 cM (Kong et al. 2002). As mentioned for rice, the difference in recombination between 'hot' and 'cold' spots is not as dramatic as in yeast probably because the resolution was at 3 Mb. Similarly in wheat, at a resolution of ∼7 Mb the average recombination frequency is 0.3 cM per Mb with a range from 0 to 7 cM.
Regions of essentially no recombination (coldspots) have been observed in all studied eukaryotes. Up to 15 kb regions lacking recombination were observed in yeast ( http:// genome-www.stanford.edu/Saccharomyces). Similar regions in human can be as large as a few Mb, and in wheat can be up to 190 Mb. Small regions of very high recombination (hotspot) are also observed in most eukaryotes. These hotspots can be only few hundred basepairs in size. There is a major hotspot around PHO8 gene of yeast located on the distal end of chromosome IV where recombination is 2 cM/kb ( http://genome www.stanford.edu/Saccharomyces). Similar hotspots have been reported in plants also. A 194 bp region around wx locus of rice has a recombination rate of 0.06 cM/kb that is 20 fold higher than the genome average (lnukai et al. 2000). Similarly, a 377 bp region of maize has a recombination rate of 0.02 cM/kb that is about 30 times higher than the genome average (Civardi et al. 1994; Yao et al. 2002). Similar regions of localized high recombination have been reported in barley, wheat, maize, rice, and other plants (Lahaye et al. 1998; Wei et al. 1999; Stein et al. 2000; Tarchini et al. 2000 Brueggeman et al. 2002). Recombination within the bronze (bz) locus of barley is 0.07 cM/kb as compared to the genome average that is 0.0002 cM/kb (Dooner 1986).
References
Akhunov ED, Goodyear AW, Geng S, Qi LL, Echalier B, Gill BS, Miftahudin, Gustafson JP, Lazo G, ChaoS, Anderson OD, Linkiewicz AM, Dubcovsky J, La Rota M, Sorrels ME, Zhang D, Nguyen HT, Kalavacharla V, Hossain K, Kianian SF, Peng J, Lapitan NL, Gonzalez-Hernandez JL, Anderson JA, Choi DW, Close TJ, Dilbirligi M, Gill KS, Walker-Simmons MK Steber C, MCGUire PE, Qualset CO and Dvorak J (2003) The organization and rate of evolution of wheat genomes are correlated with recombination rates along chromosome arms. Genome Res 13: 753-763.
Bollag RJ, Waldman AS and Liskay RM (1989) Homologous recombination in mammalian cells. Ann Rev Genet 23: 199-225.
Brueggeman R, Rostoks N, Kudrna D, Kilian A, Han F, Chen J, Druka A, Steffenson B and Kleinhofs A (2002) The barley stem rust-resistance gene Rpg1 is a novel disease-resistance gene with homology to receptor kinases. Proc Natl Acad Sci USA 99: 9328-9333.
Bussey H, Storms RK, Ahmed A, Albermann K, Allen E, Ansorge W, Araujo R, Aparicio A, Barrell B, Badcock K, Benes V, Botstein D, Bowman S, Bruckner M, Carpenter J, Cherry JM, Chung E, Churcher C, Coster F, Davis K, Davis RW, Dietrich FS, Delius H, DiPaolo T, Hani J et al. (1997) The nucleotide sequence of Saccharomyces cerevisiae chromosome XVI. Nature 387: 103-105.
Chen M, SanMiguel P and Bennetzen JL (1998) Sequence organization and conservation in sh2/a1- homologous regions of sorghum and rice. Genetics 148: 435-443.
Civardi L, Xia Y, Edwards KJ, Schnable PS and Nikolau BJ (1994) The relationship between genetic and physical distances in the cloned a1-sh2 interval of the Zea mays L. genome. Proc Natl Acad Sci USA 91: 8268-8272.
Curtis CA and Lukaszewski AJ (1991) Genetic linkage between C-bands and storage protein genes in chromosome 1B of tetraploid wheat. Theor Appl Genet 81: 245-252.
Dooner HK (1986) Genetic fine structure of
Dubcovsky J, Ramakrishna W, SanMiguel PJ, Busso CS, Yan L, Shiloff BA and Bennetzen JL (2001) Comparative sequence analysis of colinear barley and rice bacterial artificial chromosomes. Plant Physiol 125:1342-1353.
Dujon B, Albermann K, Aldea M, Alexandraki D, Ansorge W, Arino J, Benes V, Bohn C, Bolotin-Fukuhara M, Bordonne R, Boyer J, Camasses A, Casamayor A, Casas C, Cheret G, Cziepluch C, Daignan-Fornier B, Dang DV, de Haan M, Delius H, Durand P, Fairhead C, Feldmann H, Gaillon L, Kleine K et al. (1997) The nucleotide sequence of Saccharomyces cerevisiae chromosome XV. Nature 387:98-102.
Dvorak J and Chen KC (1984) Phylogenetic relationships between chromosomes of wheat and chromosome 2E of Elytrigia elongate. Can J Genet Cytol 26: 128-132.
Erayman M, Sandhu D, Sidhu D, Dilbirligi M, Baenziger S and Gill KS (2004) Gene-rich regions of wheat. Nucleic Acids Res 32: 3546-3565.
Feuillet C and Keller B (1999) High gene density is conserved at syntenic loci of small and large grass genomes. Proc Natl Acad Sci USA 96: 8265-8270.
Fu H, Park W, Yan X, Zheng Z, Shen B and Dooner HK (2001) The highly recombinogenic bz locus lies in an unusually gene-rich region of the maize genome. Proc Natl Acad Sci USA 98: 8903-8908.
Fu H, Zheng Z and Dooner HK (2002) Recombination rates between adjacent genic and retrotransposon regions in maize vary by 2 orders of magnitude. Proc Nati Acad Sci USA 99: 1082-1087.
Gill BS, Friebe B and Endo TR (1991) Standard karyotype and nomenclature system for description of chromosome bands and structural aberrations in wheat (Triticum aestivum). Genome 34: 830-839.
Gill KS, Gill BS and Endo TR (1993) A chromosome region-specific mapping strategy reveals gene rich telomeric ends in wheat. Chromosoma 102: 374-38 1.
Gill KS, Gill BS, Endo TR and Boyko E (1996a) Identification and high-density mapping of gene-rich regions in chromosome group 5 of wheat. Genetics 143: 1001-1012.
Gill KS, Gill BS, Endo TR and Taylor T (1996b) Identification and high-density mapping of gene-rich regions in chromosome group 1 of wheat. Genetics 144: 1883-1891.
IHGSC (International Human Genome Sequencing Consortium) (2001) Initial sequencing and analysis of the human genome. Nature 409: 860-921.
Inukal T, Sako A, Hirano HY and Sano Y (2000) Analysis of intragenic recombination at wx in rice: Correlation between the molecular and genetic maps within the locus. Genome 43: 589-596.
Kihara H (1944) Discovery of the DD-analyser, one of the ancestors of vulgare wheats (in Japanese). Agric Hortic 19: 889-890.
Kimber G (1970) The relationships of single alien chromosomes to the homoeologous groups of Triticum aestivum. Proc III Int Wheat Genet Symp Canberra: 62-68.
Kong A, Gudbjartsson DF, Sainz J, Jonsdottir GM, Gudjonsson SA, Richardsson B, Sigurdardottir S, Barnard J, Hallbeck B, Masson G, Shlien A, Palsson ST, Frigge ML, Thorgeirsson TE, Gulcher JR and Stefansson K (2002) A high-resolution recombination map of the human genome. Nat Genet 31: 241-247.
Kunzel G, Korzum L and Meister A (2000) Cytologically integrated physical restriction fragment length polymorphism maps for the barley genome based on translocation breakpoints. Genetics 154:397412.
Lahaye T, Shirasu K and Schulze-Lefert P (1998) Chromosome landing at the barley Rar1 locus. Mol Con Genet 260:92-101.
Lichten M and Goldman ASH (1995) Meiotic recombination hotspots. Ann Rev Genet 29: 423-444.
McFadden ES and Sears ER (1946) The origin of Triticum spelta and its free-threshing hexaploid relatives. J Hered 37: 81-89.
Mewes HW, Albermann K, Bahr M, Frishman D, Gleissner A, Hani J, Heumann K, Kleine K, Maierl A, Oliver SG, Pfeiffer F and Zollner A (1997) Overview of the yeast genome. Nature 387: 7-65.
Panstruga R, Buschges R, Piffanelli P and Schulze-Lefert P (1998) A contiguous 60 kb genomic stretch from barley reveals molecular evidence for gene islands in a monocot genome. Nucleic Acids Res 26: 1056-1062.
Rahman S, Abrahams S, Abbott D, Mukai Y, Samuel M, Morell M and Appels R (1997) A complex arrangement of genes at a starch branching enzyme I locus in the D-genome donor of wheat. Geuome 40:465-474.
Rostoks N, Park YJ, Ramakrishna W, Ma J, Druka A, Shiloff BA, SanMiguel PJ, Jiang Z, Brueggeman R, Sandhu D, Gill KS, Bennetzen JL and Kleinhofs A (2002) Genomic sequencing reveals gene content, genomic organization, and recombination relationships in barley. Fund Integr Genomics 2:51-59.
Sandhu D and Gill KS (2002a) Gene-containing regions of wheat and the other grass genomes. Plant Physiol 128: 803-811.
Sandhu D and Gill KS (2002b) Structural and functional organization of the '1SO.8 gene-rich region' in the Triticeae. Plant Mol Biol 48: 791-804.
Shirasu K, Schulman AH, Lahaye T and Schuize-Lefert P (2000) A contiguous 66-kb barley DNA sequence provides evidence for reversible genome expansion. Genome Res 10: 908-915
Sidhu D and Gill KS (2004) Distribution of genes and recombination in wheat and other eukaryotes. Plant Cell Tissue Organ Culture 79: 257-270.
Stein N, Feuillet C, Wicker T, Schlagenhauf E and Keller B (2000) Subgenome chromosome walking in wheat: a 450-kb physical contig in Triticum monococcum L spans the Lr10 resistance locus in hexaploid wheat (Triticum aestivum L.). Proc Natl Acad Sci USA 97: 13436-13441.
Tarchini R, Biddle P, Wineland R, Tingey S and Rafalski A (2000) The complete sequence of 340 kb of DNA around the riceAdh1-Adh2 region reveals interrupted colinearity with maize chromosome 4. Plant Cell 12: 381-391.
TAGI (The Arabidopsis Genome Initiative) (2000) Analysis of the genome sequence of the flowering plant Arabidopsis thaliana. Nature 408:796-815.
Tikhonov AP, SanMiguel PJ, Nakajima Y, Gorenstein NM, Bennetzen JL and Avramova Z (1999) Colinearity and its exceptions in orthologous adh regions of maize and sorghum. Proc Natl Acad Sci USA 96: 7409-7414.
Tranquilli G, Lijavetzky D, Muzzi G and Dubcovsky J (1999) Genetic and physical characterization of grain texture-related loci in diploid wheat. Mol Gen Genet 262: 846-850.
Venter JC, Adams MD, Myers EW, Li PW, Mural RJ, Sutton GG, Smith HO, Yandell M, Evans CA, Holt RA, Gocayne JD, Amanatides P, Ballew RM, Huson DH, Wortman JR, Zhang Q, Kodira CD, Zheng XH, Chen L, Skupski M, Subramanian G, Thomas PD, Zhang J et al. (2001) The sequence of the human genome. Science 291: 1304-1351.
Wei F, Gobelman-Werner K, Morroll SM, Kurth J, Mao L, Wing RA, Leister D, Schulze-Lefert P and Wise RP (1999) The M1a (powdery mildew) resistance cluster is associated with three NBS-LRR gene families and suppressed recombination within a 240-kb DNA interval on chromosome 5S (1HS) of barley. Genetics 153: 1929-1948.
Wei F, Wing RA and Wise RP (2002) Genome dynamics and evolution of the Mla (powdery mildew) resistance locus in barley. Plant Cell 14: 1903-1917.
Wicker T, Stein N, Albar L, Feuillet C, Schlagenhauf E and Keller B (2001) Analysis of a contiguous 211 kb sequence in diploid wheat (Triticum monococcum L.) reveals multiple mechanisms of genome evolution. Plant J 26: 307-316.
Wu J, Maehara T, Shimokawa T, Yamamoto S, Harada C, Takazaki Y, Ono N, Mukai Y, Koike K, Yazaki J, Fujii F, Shomura A, Ando T, Kono I, Waki K, Yamamoto K, Yano M, Matsumoto T and Sasaki T (2002) A comprehensive rice transcript map containing 6591 expressed sequence tag sites. Plant Cell 14: 525-535.
Yao H, Zhou Q, Li J, Smith H, Yandeau M, Nikolau BJ and Schnable PS (2002) Molecular characterization of meiotic recombination across the 140-kb multigenic a1-sh2 interval of maize. Proc Natl Acad Sci USA 99: 6157-6162.