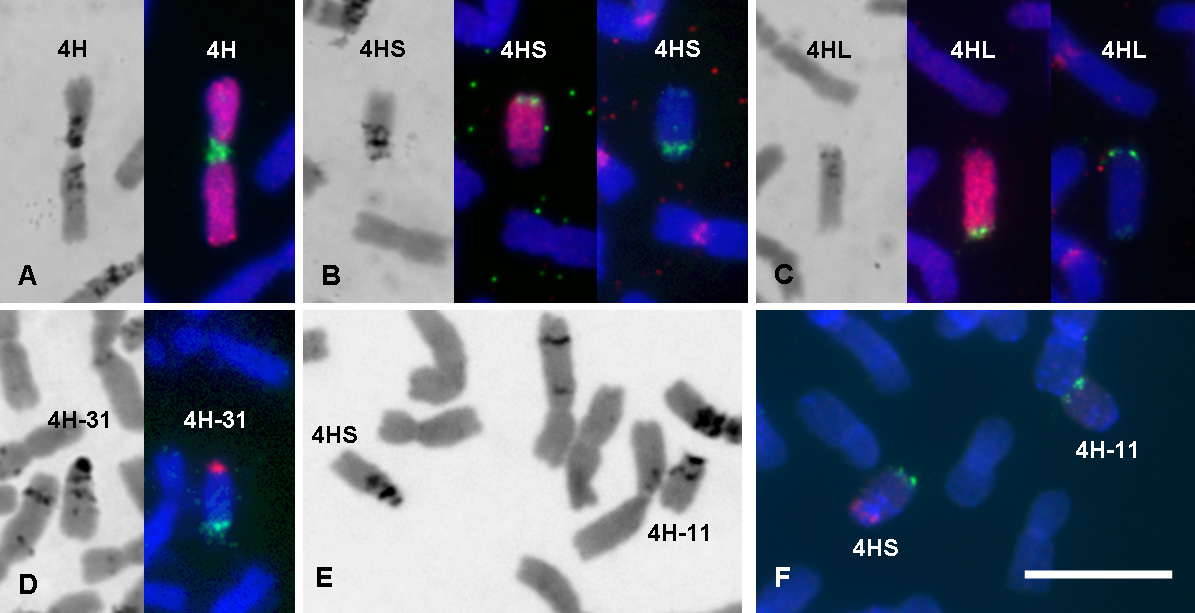
Figure 1. C-band and FISH/GISH analysis of barley chromosome 4H and its derivatives with structural changes isolated in common wheat. (A) Sequential C-band (left) and FISH/GISH (right) images of an identical chromosome of the normal 4H chromosome. The green FISH signal, pink GISH signal and blue stain show the (AGGGAG)n repeats, barley chromosome and wheat chromosomes, respectively. (B) Sequential C-band (left), FISH/GISH (middle) and FISH (right) images of an identical chromosome of the standard 4HS telosome. The green FISH signal, pink GISH signal and blue stain in the middle image show the barley-specific subtelomeric repetitive sequence HvT01 (Belostotsky and Ananiev 1990), barley chromosome and wheat chromosomes, respectively. The green and pink FISH signals in the right image show the (AGGGAG)n repeats and wheat centromere-specific 192-bp repetitive sequence (Ito et al. 2004). (C) Sequential C-band (left), FISH/GISH (middle) and FISH (right) images of an identical chromosome of the standard 4HL telosome. The green FISH signal, pink GISH signal and blue stain in the middle image show the HvT01 repeats, barley chromosome and wheat chromosomes, respectively. The green and pink FISH signals in the right image show the (AGGGAG)n repeats and 192-bp repeats. (D) Sequential C-band (left) and FISH (right) images of the 4H-31 chromosomes from different plants. The green and pink FISH signals show the HvT01 and (AGGGAG)n repeats, respectively. (E) C-band image of the regular 4HS telosome and 4H-11 chromosome in the same mitotic metaphase cell. Note 4H-11 lacked the most distal heterochromatin. (F) FISH image of the regular 4HS telosome and 4H-11 chromosome in the same mitotic metaphase cell. The green and pink FISH signals show the HvT01 and (AGGGAG)n repeats, respectively. The white bar=10 μm. The magnification is the same for A-F.