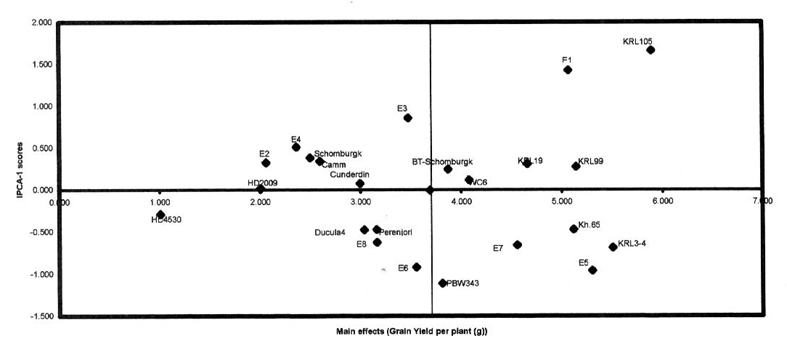
Fig. 1.
Biplot for grain yield showing main and interaction effects for both genotypes and environments.