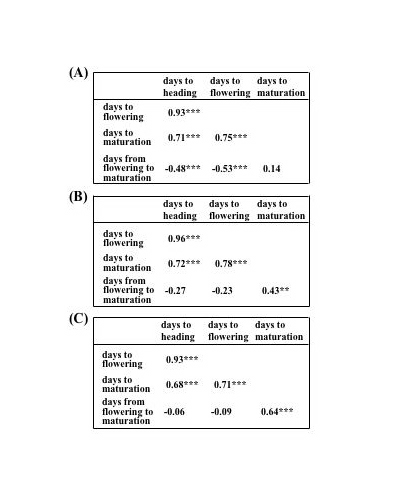
Figure 4. Correlation coefficients (r) among the examined traits in the three F2 populations. **; p < 0.01, ***; p < 0.001
(A) Shiroganekomugi x KU-4770 F2 population.
(B) Shiroganekomugi x KU-180 F2 population.
(C) S-615 x Chinese Spring F2 population.