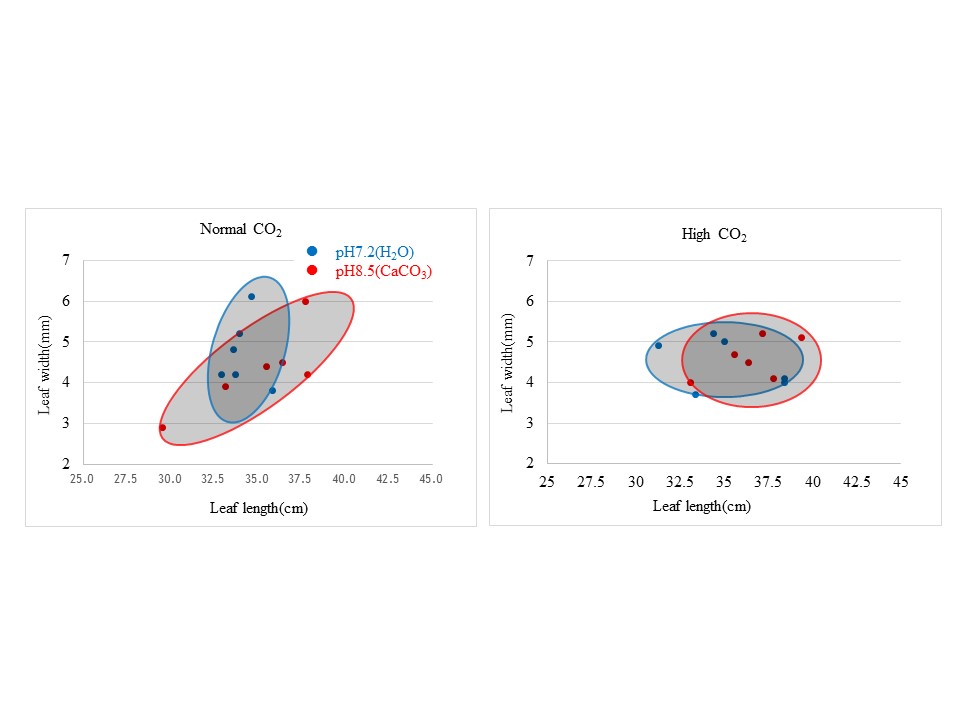
Figure 3. Correlation chart of leaf length and leaf width. (A) Normal CO2 condition. (B) High CO2 condition.