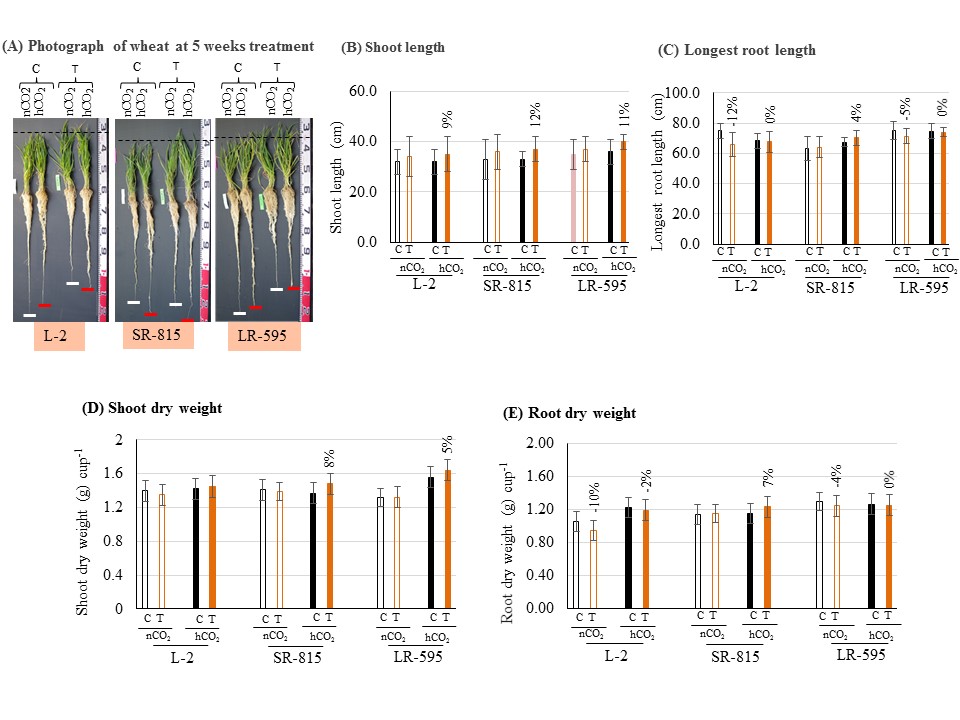
Figure 2. Effect of high CO2 on root and shoot growth. (A) Comparison on morphology of Lalmi-2, SR-815 and LR-595 for different doses of CO2. (B) Shoot length (cm). (C) Longest root length (cm). (D) Shoot dry weight (g). (E) Whole root dry weight (g). Values represent the mean ± SE (n=10). Percentages indicate the rate of changes due to the control and CaCO3 treatments. n, normal CO2 condition (400-500 ppm); h, high CO2 condition (800-1000 ppm).