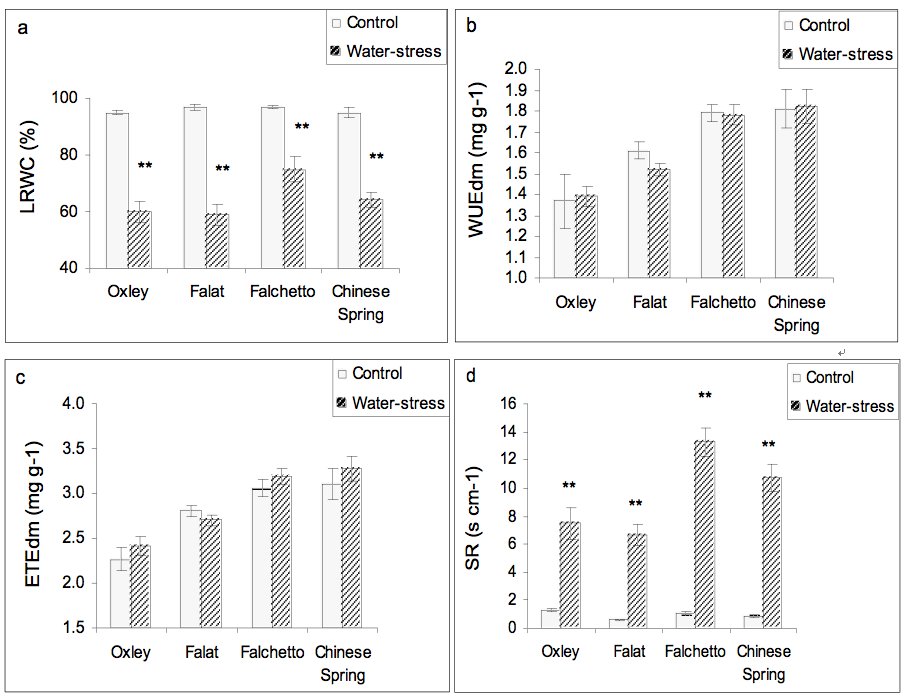
Fig. 1
The effect of water-stress on (a) LRWC, (b) WUEveg, (c) ETEveg and (d) SR. Standard errors of means are shown by vertical bars.
**: significantly different from control at P<0.01