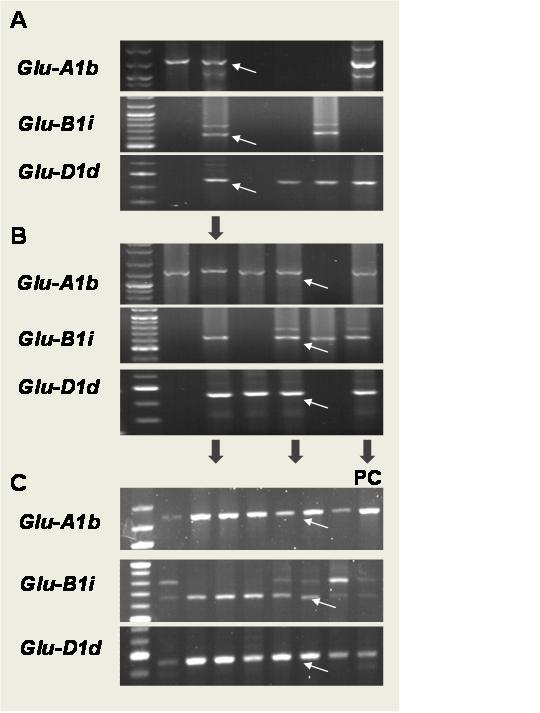
Fig. 2. A represents analysis of DNA tags from flag leaves in a selected number of F2 individuals from which only the second (from left) F2 segregant appeared to possess all three alleles; B represents presence / absence of the three alleles in a selected F3 segregants; and C is the demonstration of DNA analysis in a selected seedling plants at F4 generation indicating all F4 individuals that were selected via MAS possess all three alleles. The lane PC represents positive control samples for Glu-A1b in cultivar ‘Chenab’(upper figure), Glu-B1i in cultivar ‘Golestan’(middle row figure), and Glu-D1d allele in cultivar ‘Inia' (lower row figure), respectively.