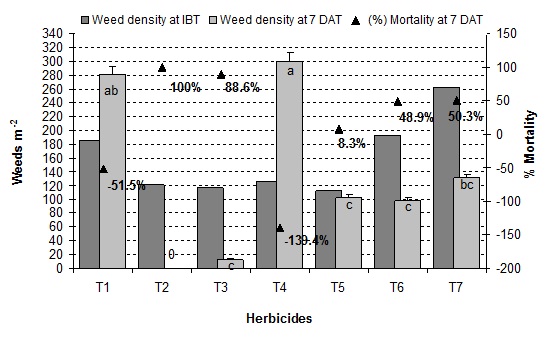
Fig. 3. Weed density m-2 and weed mortality (%) in 7 DAT compared to IBT plots. Bars indicate error bars (±SD) and different letters indicate significant differences at the 5% level. Bars without error bars and letters indicate no significant differences. IBT - immediately before treat by herbicides, DAT - days after treat by herbicides, DAS – days after sowing. T1 = weedy check (no weed control up to harvest), T2 = Affinity 50.75 WP at 1.25 kg ha-1 at 30 DAS, T3 = Hammer 24 EC at 100 ml ha-1 at 30 DAS, T4 = 2, 4-D Amine at 1200 ml ha-1 at 30 DAS, T5 = U 46 at 1400 ml ha-1 at 30 DAS, T6 = Lintur 70 WG at 250 g ha-1 at 30 DAS, T7 = one hand weeding at 30 DAS.